Flowcharts are one of the simplest yet most powerful tools for visualizing processes, making them easier to understand and optimize. In this guide on flowcharting basics, we’ll walk you through the essential symbols, best practices, and ready-to-use templates to help you create clear and effective flowcharts.
What Is the Purpose of a Flowchart?
Flowcharts are probably the most popular diagram type in the world. So it pays to know how to read a flowchart and know the flowcharting basics. You can use them to,
- Improve your processes by identifying bottlenecks and defects
- Communicate/explain a process to someone
- Easily visualize complex processes
Whether you’re mapping out a business workflow, troubleshooting a system, or documenting a procedure, flowcharts help break down complex tasks into clear, step-by-step diagrams. Flowcharts also serve as an effective communication tool, ensuring that everyone involved in a process has a shared understanding. From software development to project management and manufacturing, flowcharts provide clarity, reduce errors, and enhance productivity.
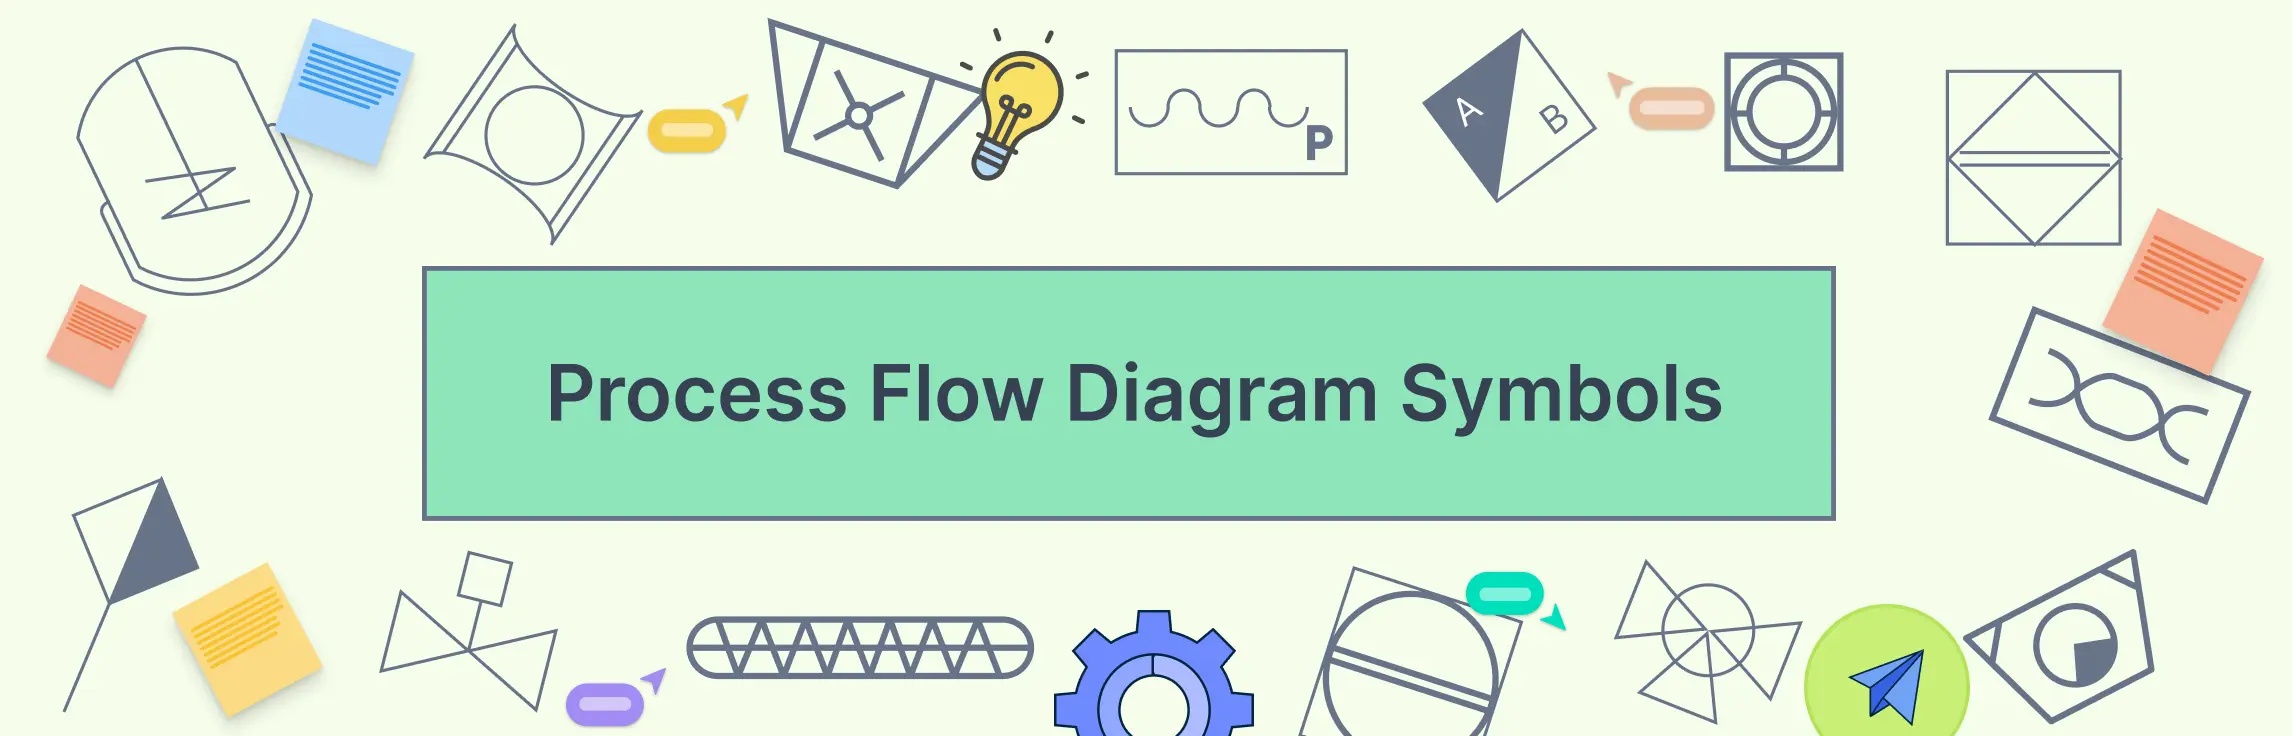
What Are the Basic Symbols Used in Flowcharts?
Flowcharts use a set of standard symbols to represent different steps in a process. Knowing these basic symbols is key to mastering flowcharting basics and creating clear, effective diagrams. Here are a few essential ones:
- Terminator – Represents the start or end of a flowchart
- Process – Shows a step or action in the process
- Decision – Indicates a decision point with different outcomes
- Input/Output – Represents information entering or leaving the system
- Arrows – Connect the symbols and show the flow of the process
There are many more symbols you can use, depending on the complexity of your flowchart. For a full breakdown of the symbols and their meanings and improve your knowledge on flowcharting basics check out our guide on flowchart symbols.
What Are the Basic Flowchart Types
Flowcharts come in different types, each suited for specific needs. Understanding these is an important part of flowcharting basics, helping you pick the right one for your process. Here are some of the most common types:
- Process flowchart – The most widely used type, mapping out a step-by-step sequence of actions in a process. It helps identify inefficiencies and improve workflows.
- Workflow diagram – Focuses on how tasks move between individuals or teams, making it useful for project management and business operations.
- Decision flowchart – Visualizes decision-making paths, showing different outcomes based on conditions. It’s helpful for troubleshooting and strategic planning.
- Data flow diagram – Shows how data moves through a system, commonly used in software development and system design.
- Swimlane flowchart – Organizes process steps into lanes to clarify roles and responsibilities across teams or departments.
Each type serves a different purpose, so choosing the right one ensures your flowchart effectively communicates the process. Want a deeper dive? Check out our full guide on flowchart types to master flowcharting basics.
A Few Best Practices in Flowcharting
When learning flowcharting basics, it’s important not just to know the symbols but also to follow some flowchart rules and guidelines to ensure your flowcharts are effective and easy to understand. Here are a few best practices to keep in mind:
- Proper form is essential – A good flowchart lists all steps in a logical order. Make sure the flow of your process makes sense and is easy to follow.
- Clarity is paramount – The flowchart should be neat and clear, with no ambiguity. Anyone should be able to understand the process without confusion.
- Stick to the right direction – Flow generally moves from left to right or top to bottom. Keeping this consistent helps the reader follow the process more naturally.
- Follow flow line standards – Ideally, one flow line should come out of each process symbol. A decision symbol should have one flow line entering it and up to three leaving, depending on the possible outcomes. Keep terminal symbols with only one flow line.
- Be concise, not copious – Keep your text brief and to the point. Use the standard flowchart symbols to communicate your message clearly without cluttering the diagram.
- Logic precedes everything – If you’re dealing with a complex flowchart, use connector symbols to avoid excessive flow lines. Crossed lines can make a flowchart harder to read, so ensure your flowchart has a logical start and finish.
Flowchart Examples
Ready to dive into flowcharting basics? Here are a few simple flowchart templates to help you get started quickly. Drawing from scratch can be time-consuming, so we’ve created some easy-to-use flowcharts for you. Simply click on the image to start modifying these templates directly with our free flowchart software.


Here’s another simple flowchart with a bit more steps;

This one comes with a swimlane to convey the different roles or departments involved in the process;

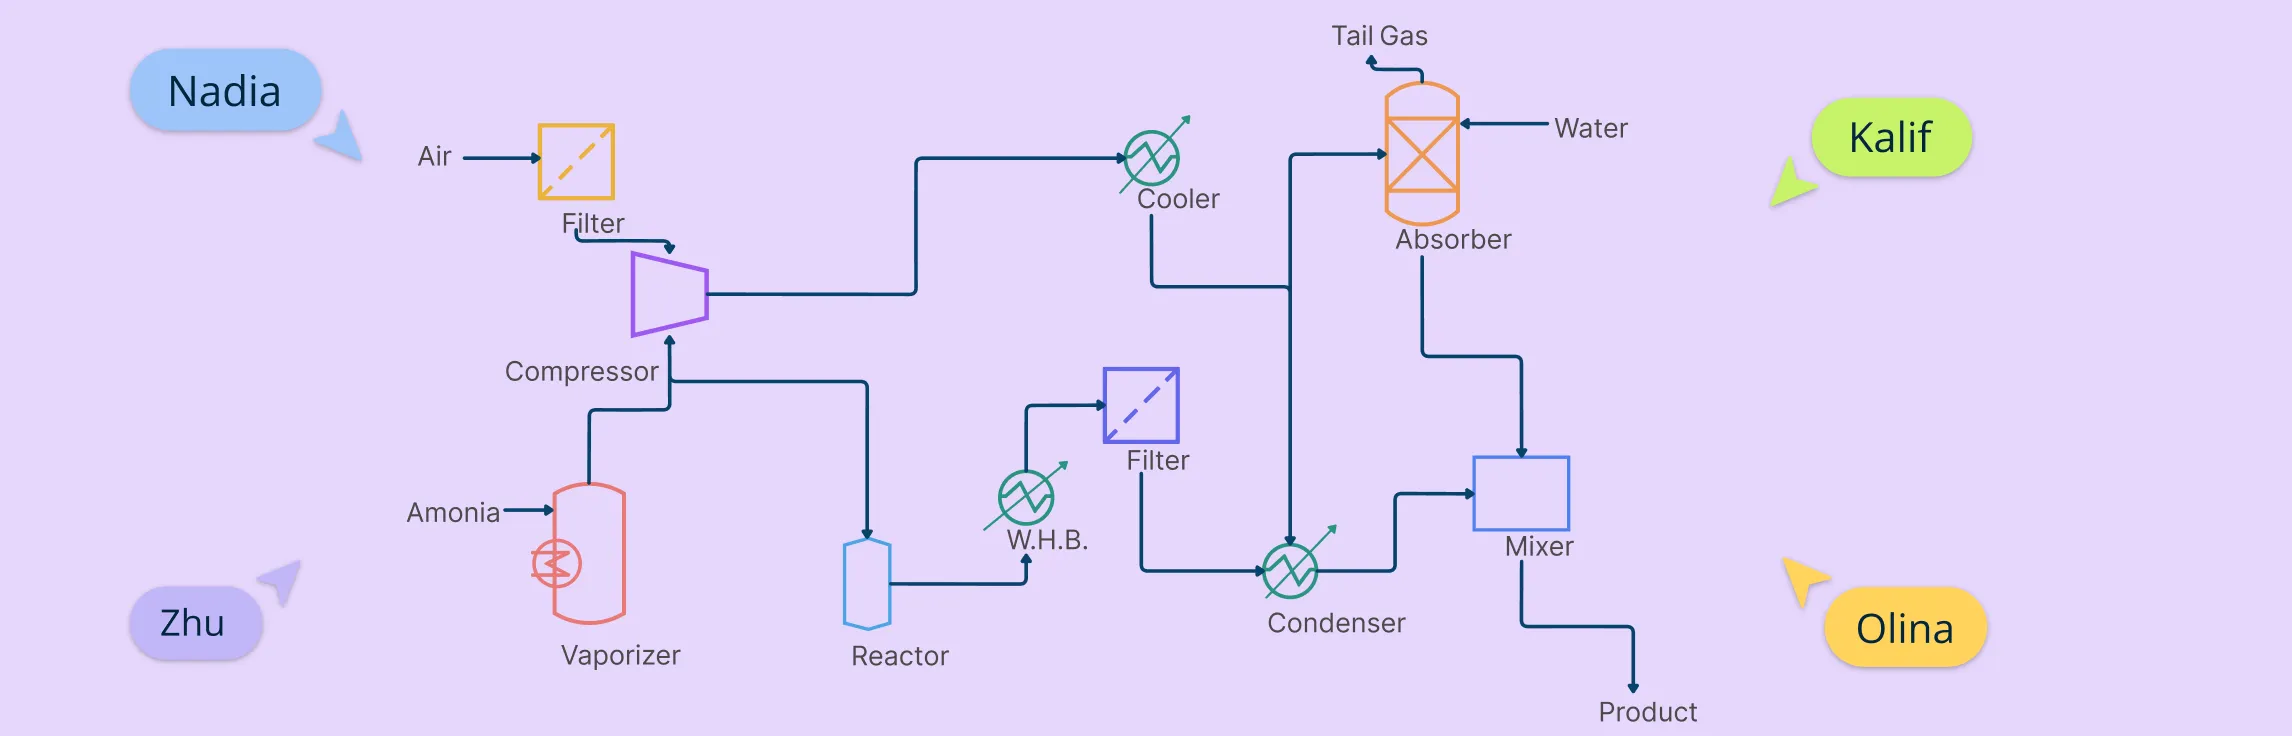
This next one uses an extensive set of flowchart shapes to visualize the different elements involved in the process;

These are just a few examples to get you started. There are plenty more templates available—browse our full collection to find the perfect flowchart templates for your needs!
Tools for Basic Flowcharting
When it comes to mastering flowcharting basics, having the right tool can make a huge difference. Creately’s flowcharting tool is designed to help you create professional, clear flowcharts quickly and easily. Whether you’re a beginner or an experienced pro, Creately offers a variety of features to simplify the process:
- Intuitive drag-and-drop interface – No more struggling with complex software. Creately’s user-friendly design allows you to drag and drop shapes, connectors, and symbols effortlessly.
- Pre-designed templates – Get started fast with a variety of professionally designed flowchart templates that can be customized to suit your needs.
- Real-time collaboration – Work with your team in real time, making it easy to create and edit flowcharts together, no matter where you are.
- Customizable shapes and symbols – Tailor your flowchart with a wide range of standard and custom symbols to match your specific process.
- One-click create and connect – This time-saving feature lets you easily connect shapes and symbols with just one click, streamlining the diagramming process.
- Cloud-based accessibility – Access your flowcharts anytime, anywhere, from any device with Creately’s cloud-based platform.
Your Thoughts on the Flowcharting Basics Guide
In conclusion, understanding flowcharting basics is a crucial skill for visualizing processes and improving workflows. Whether you’re creating simple diagrams or mapping out complex systems, following the right guidelines and using the right tools can make all the difference. By mastering the key flowchart symbols, types, and best practices, you’ll be able to communicate ideas clearly and optimize your processes effectively. If you’re ready to start creating your own flowcharts, tools like Creately make the process easy and efficient. Happy flowcharting!
Some key guidelines for system flowcharting include: An effective flowchart should be:FAQs on Flowcharting Basics
What are the necessary things to consider in doing a flowchart?
What are the basics of flowcharts?
What are some basic guidelines for proper system flowcharting?
What are the key requirements to ensure a flowchart is effective?