Spider Diagram Maker
Discover and Organize Your Best Ideas
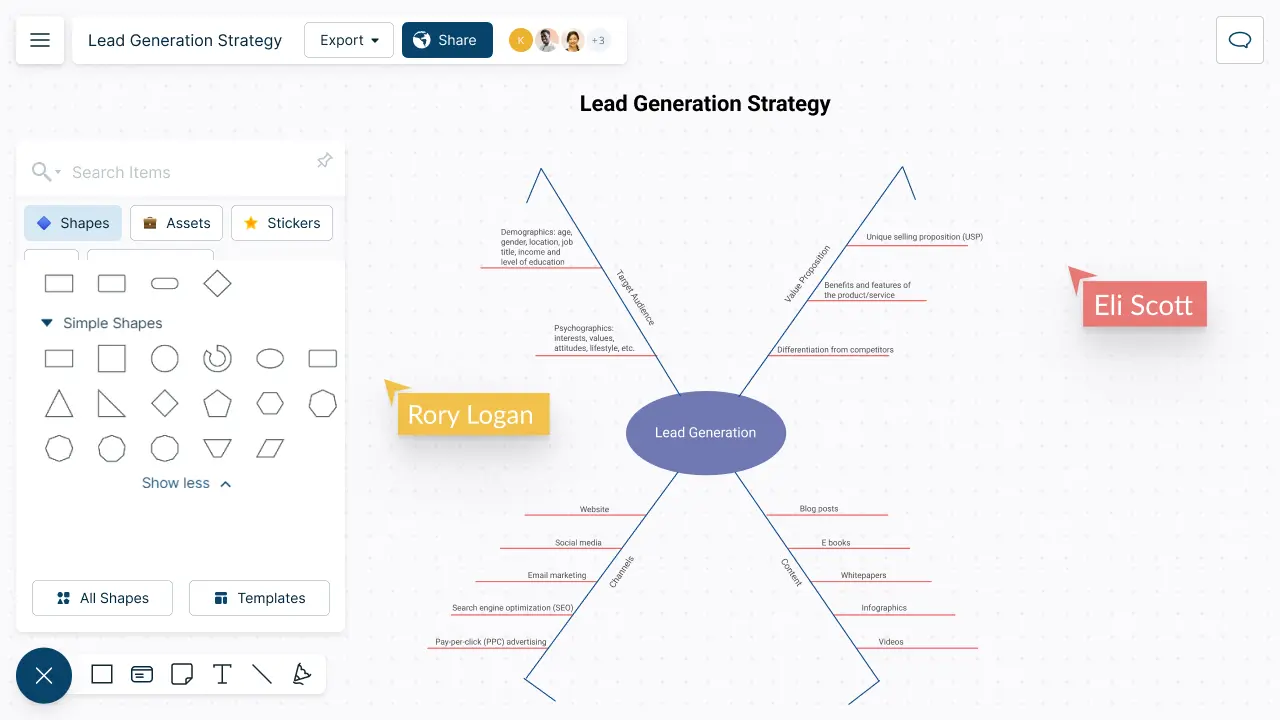
Use this visual brainstorming technique to visually organize concepts and generate ideas with your team.
- Customizable spider diagram templates
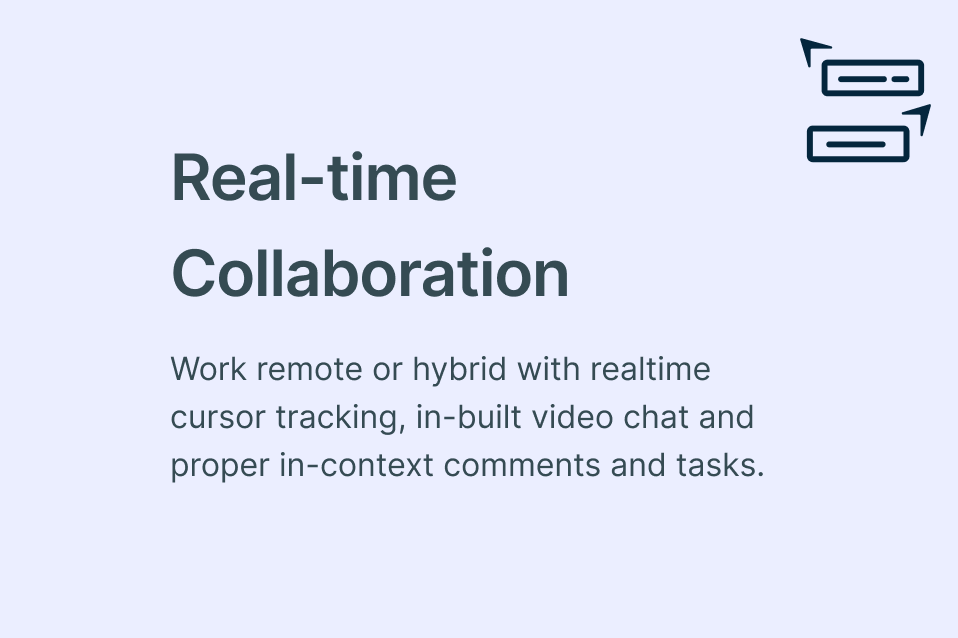
- Real-time visual collaboration
- PNG, SVG, and PDF export
- Customizable spider diagram templates
- Real-time visual collaboration
- PNG, SVG, and PDF export


How to make a Spider Diagram?
Let Ideas Flow Freely

Multiple spider diagram templates to focus on brainstorming.
Quickly add ideas to the canvas with simple to use drag and drop tools.
Organize related concepts using automatic drawing with Plus Create and color themes.

Add Context to Brainstorming Sessions
Import images, vectors and more to create data-rich and informative diagrams.
Embed documents and references and link them to specific topics.
Streamline sharing, reviewing, and editing with advanced collaborator controls.
Rapidly Generate & Structure Ideas

Collaborate on a shared canvas; add multiple collaborators and generate ideas together.
Comment with context, have discussions and follow-ups on the same canvas. Async!
Export as SVGs, PDFs, and PNGs to publish, present, print, or share.
Built-in presentation tools to create and conduct interactive presentations.

 Templates

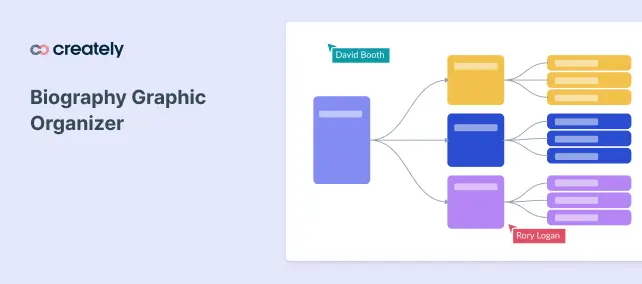
What is a Spider Diagram?
How Can Teams Collaborate Around Creately’s Spider Diagram Maker?
Teams can collaborate around a spider diagram to develop a shared understanding, find patterns and insights and make informed decisions, especially in terms of complex data. Spider diagrams also encourage teamwork, collaboration and support to build a data-driven decision making culture in an organization.
Use Creately’s brainstorming capabilities such as whiteboard and free-hand drawing tools to gather the team to brainstorm and figure out the required variables for the spider diagram.
Create a single-source of truth. Start a workspace and provide the required permission levels for team members to include their ideas and research in one-central location. Each team member should conduct a thorough research, collect and analyze data from various sources before including the information.
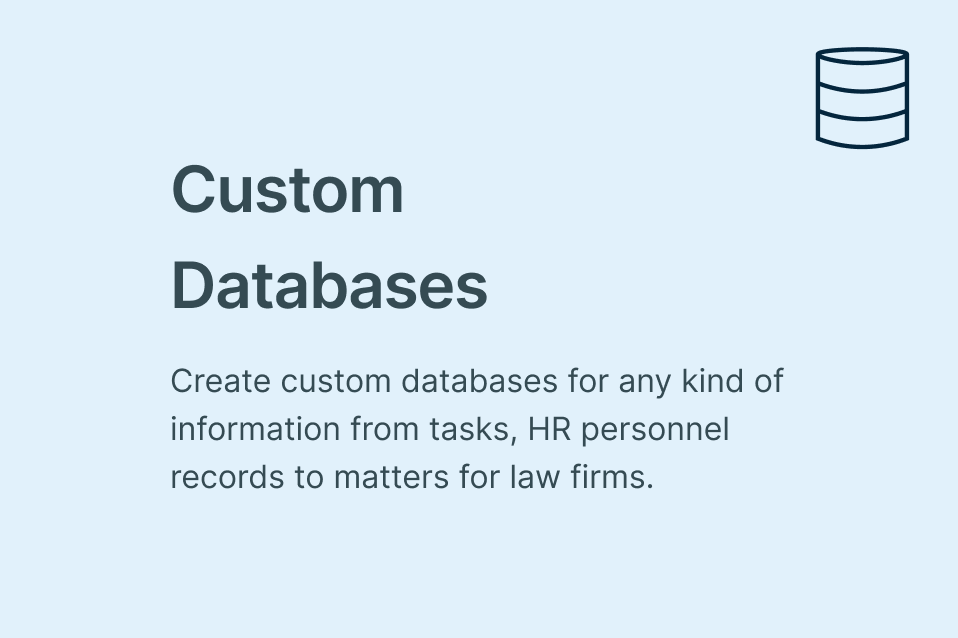
Use Creately as a data and information repository. Use the notes and data panel to house important information, references, images and documents.
Present the data in a clear and visually appealing manner. Use Creately’s frames, shapes, color themes and advanced formatting options to create presentation and report-like layouts.
Use Creately’s full version history to revert back to previous iterations if needed.
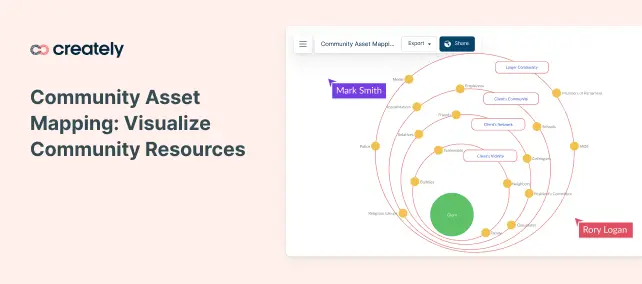
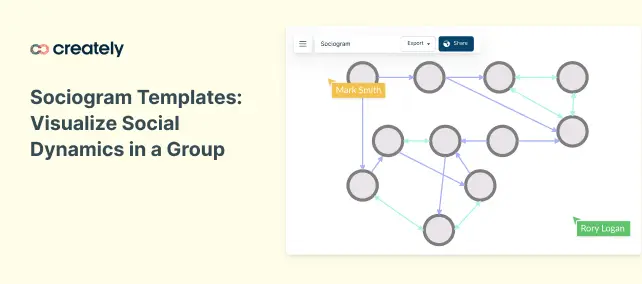
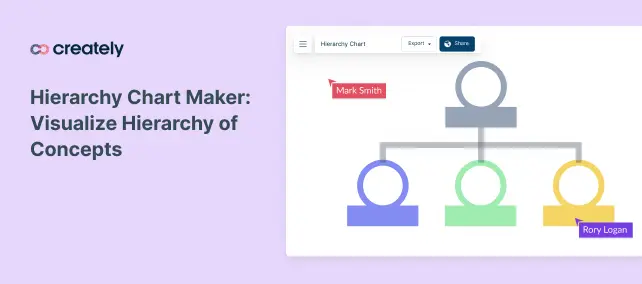
Popular Use Cases for Visualizing Concepts


How to Make a Spider Diagram with Your Team?
- First, identify the main topic or goal
Start by identifying the main topic or goal that the spider diagram will focus on. Gather all your team members together and clearly communicate the focus area and lay the ground rules.
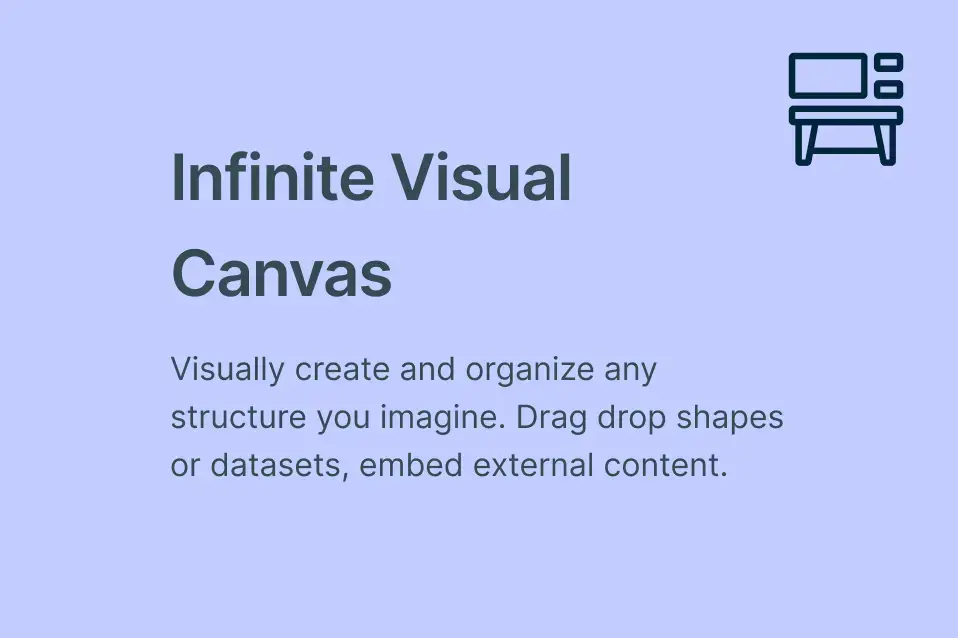
At the sametime, identify the right platform to conduct a collaborative brainstorming session. Creately’s infinite canvas and real-time collaboration features are great for teams to exchange ideas and spark innovation.
- Have a brainstorming session
Brainstorm with your team to kickstart ideation and note down all ideas and related sub-topics. Encourage every team member to participate actively and to give their input and ideas. Use Creately’s integrated conferencing, built-in whiteboard and freehand drawing capabilities to have lively discussions and meetings.
- Organize the subtopics
Organize all subtopics and ideas in a logical manner, grouping similar ideas together. You can use the tables function to group ideas together for easy analysis.
- Create the diagram
Assign a team member to take the lead in creating the diagram. This team member will be responsible for organizing and structuring the information.
With the information gathered, start creating the spider diagram by listing the main topic in the center of the workspace in a circle. Then include the subtopics around the main idea. Use lines or arrows to connect them to the main topic. Now create more detailed sub-ideas around the subtopics; keep going until your team has explored a topic in detail. Use color codes to visually group ideas and sub-ideas to create an easy reference with logical links.
- Analyze the finalized diagram and data
Analyze the data together with the team to identify patterns and insights. Discuss the implications of the presented data and use it to make informed-decision or develop necessary strategies.
- Review and feedback
Once the diagram is completed, share via email or invite links with team members or relevant stakeholders for feedback and insights. Use in-line commenting or @mentions to get feedback and input.
Have a final review and editing session to ensure the spider diagram is clear, accurate and easy to understand. Make sure that the team continues to collaborate around the spider diagram overtime. Refine the variables and data points and make changes based on new insights or data as required.
Effectively Organize Ideas and Concepts with These Spider Diagram Templates


FAQs About the Spider Diagram Maker
A visual brainstorming technique, spider diagrams are commonly used for organizing and visualizing ideas.
Idea generation: Helps brainstorm ideas around a topic
Research: Quickly organize ideas in an easy to understand manner during a research
Note-taking: Information you gather during lessons can be easily taken down with a spider diagram
Presentation: Using spider diagrams, an idea or concept can be presented in an engaging way
Guides and Resources to Visually Brainstorm With Your Team


- Unlimited Canvases
- 5000 items per Canvas
- Premium Shape Libraries
- 20 Active Folders
- Unlimited Imports
- JPEG, PNG, SVG & PDF export
- Premium Templates
- AI Diagrams
- 30 day version history
- Basic collaboration
- Email Support
- Unlimited Canvases
- 5000 items per canvas
- Premium Shape Libraries
- 50 active folders
- Unlimited Imports
- JPEG, PNG, SVG & PDF export
- Premium Templates
- AI Diagrams
- 30 day version history
- Advanced collaboration
- Email / Chat Support
- Multiple named users
- Account Management Portal
- 3 Canvases
- 60 items per canvas
- Standard Shape Libraries
- 1 Folder
- 2 Imports
- JPEG and PNG export only
- 50,000 items per canvas
- Unlimited folders
- MS Teams, Slack and Github Integrations
- 2 way data sync with Excel/Google Sheets
- HR, Product, IT, Process toolkits
- Unlimited databases
- 5000 items per database
- 1 year version history
- Project management tools
- Dedicated customer success manager
- Guest access
- Custom templates
- Single Sign On / 2FA
- Regional Data Servers
- MS Teams, Slack and Github Integrations
- 2 Way Data Sync with Excel/Sheets
- Multiple Account Admins
- Multiple Sub Teams
- Unlimited Databases
- Unlimited Items per Database
- SLA
- Member Onboarding and Training
- Managed Member offboarding
- Audit Logs
- Dedicated Customer Success Manager
