
Tree diagrams are powerful visual tools used extensively for organizing and presenting complex data in a structured, understandable format. By mapping out hierarchical relationships between different elements, tree diagrams help users grasp detailed information quickly and make informed decisions.
This blog post will guide you through different types of tree diagrams, their components, practical applications, and best practices for creating effective diagrams. Whether you’re a project manager, a student, or a software developer, understanding how to effectively utilize tree diagrams can significantly enhance your analytical and presentation skills.
What Are Tree Diagrams?
A tree diagram is a graphical representation that starts with a single node, typically known as the root, from which various branches spread out to illustrate relationships or categories. Each branch leads to additional nodes, which represent subcategories or decisions, forming a network of connections that resemble the branches of a tree. This hierarchical structure is particularly effective in breaking down complex information into digestible chunks.
Tree diagrams are used in various fields such as business, education, and technology, providing clarity and facilitating strategic planning and decision-making. The benefits of using tree diagrams include enhanced organization of data, clear visualization of relationships and hierarchies, and improved communication of complex processes.


How to Make a Tree Diagram
Identify the Purpose and Scope
Begin by defining what you want to achieve with your tree diagram. This clarity will guide the design and complexity of your diagram.
Gather and Organize Information
Collect all necessary data that needs to be included. Organize this information hierarchically to align with the tree structure, ensuring that each level of the tree serves a clear purpose.
Construct Your Tree Diagram
Start by placing the root node, and then systematically adding branches and leaves. Each node should represent a single concept or data point, clearly linked to the overarching theme. You can use colour themes and formatting styles to distinguish between different types of information.
Creately offers customizable tree diagram templates to help you create your diagram quickly and easily. You can also use the notes panel to include additional information to each shape or node so that all information about what you want to illustrate can be found in one place.
Review and Revise
Once your tree diagram is drafted, review it for clarity and accuracy. Make adjustments as needed to improve readability and ensure that the diagram effectively communicates the intended message.
By following these steps, you can create tree diagrams that not only look professional but also serve their intended purpose effectively. Remember, the key to a successful tree diagram is in its ability to simplify complex data and make it accessible to your audience.
Different Types of Tree Diagrams Explained
Understanding the different types of tree diagrams can help you select the most effective one for your specific needs. Here, we explore the main categories of tree diagrams, each serving distinct purposes and offering unique benefits.
Statistical Tree Diagrams
These are used primarily in statistical analysis to visually break down and examine the probabilities of different outcomes. They are invaluable in fields like market research and data science for predicting future trends based on historical data.

Analytical Tree Diagrams
Often used in quality management and operations research, these diagrams help in identifying the root causes of problems. They are crucial for systematic analysis and for making informed decisions to enhance operational efficiency.

Decision Tree Diagrams
These are used to map out the decision-making process, showing different paths and their potential outcomes based on certain decisions. Decision trees are particularly beneficial in strategic business planning and risk management. For more detailed examples, you can explore decision tree examples.

Choosing the right type of tree diagram depends on your specific needs. Whether you are analyzing data, managing quality, or making complex decisions, there is a tree diagram that can help streamline the process and clarify your options. By leveraging the right type of tree diagram, you can enhance your ability to organize and interpret complex information, leading to more effective decision-making.
Key Components of a Tree Diagram
A tree diagram consists of several integral elements:
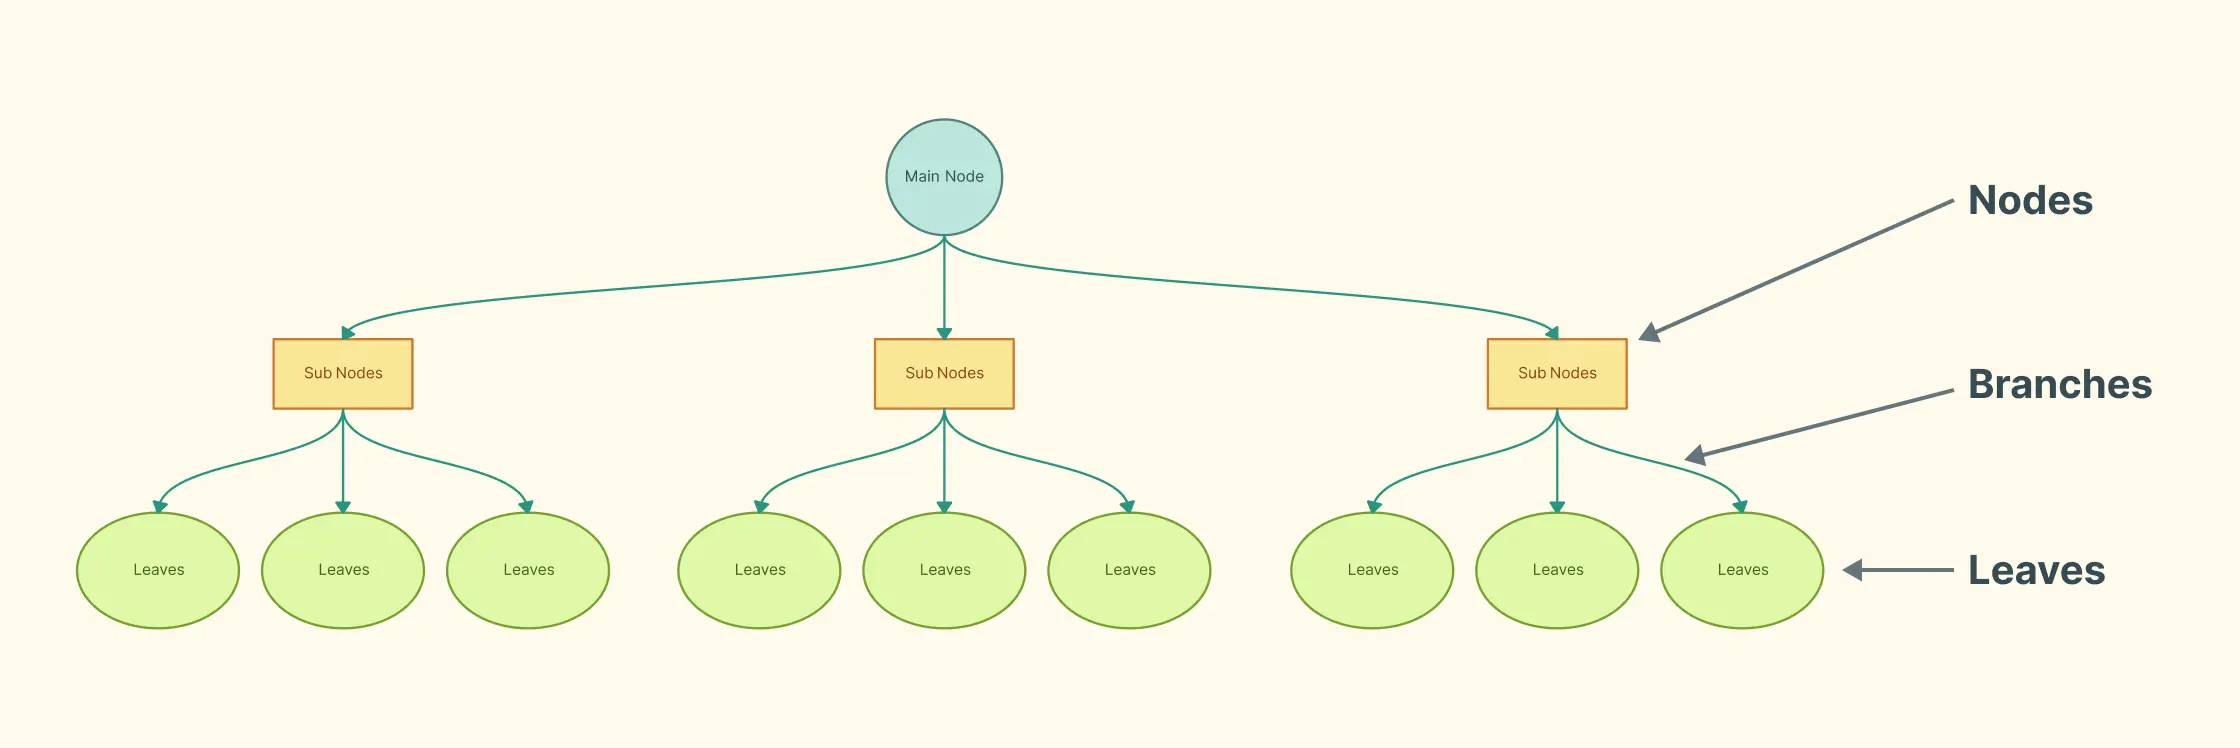
Nodes
These are the points, often represented as circles or boxes, where data splits into branches. Each node represents a decision point or a data subset.
Branches
Lines connecting nodes, represent the relationship and flow between them.
Leaves
The endpoints of a tree diagram, which do not branch out further, represent final outcomes or decisions.
These components work together to map out complex information in a structured and digestible format, making tree diagrams a useful tool in various fields.
Practical Applications of Tree Diagrams in Various Fields
Tree diagrams are not just theoretical constructs; they have practical applications across various fields, significantly enhancing decision-making and organizational processes. By visually breaking down complex data, tree diagrams provide a clear path to understanding intricate systems and making informed decisions.
Business Decision-Making: In the realm of business, tree diagrams are effective for mapping out decision-making processes. They help visualize different outcomes based on varied decisions, thus aiding managers and stakeholders in choosing the most effective strategies. For instance, using a Business Model Canvas can be complemented by a decision tree to evaluate potential business strategies.
Educational Tools: Educators use tree diagrams to explain complex topics such as biological classifications or historical events, making it easier for students to grasp and remember the information. These diagrams can serve as a visual aid to enhance learning and retention.

Software Development: In software development, tree diagrams are used to plan projects and visualize workflows, ensuring all team members understand the scope and sequence of tasks.
Research and Data Analysis: Researchers utilize tree diagrams to categorize data and visualize the relationships between different variables. This is particularly useful in fields like market research or epidemiology, where understanding the connections between data points is crucial. The Research Data Analysis Methods page provides further insights into how tree diagrams can be employed effectively.
Healthcare Planning: In healthcare, tree diagrams facilitate the diagnosis and treatment planning processes by clearly outlining patient symptoms and possible interventions. This methodical approach ensures that all potential health scenarios are considered and managed appropriately.
These real-world applications demonstrate the versatility and utility of tree diagrams across different sectors. By providing a hierarchical visual representation of information, tree diagrams enable professionals in various fields to simplify complex data, enhance understanding, and improve decision-making processes.
Best Practices for Crafting Clear and Useful Tree Diagrams
Creating effective tree diagrams is not just about understanding the data but also about presenting it in a way that is accessible and intuitive. Here are some best practices to ensure your tree diagrams are both clear and useful:
Keep the Design Simple
A cluttered diagram can obscure the data it’s meant to clarify. Aim for simplicity in your design, using clean lines and avoiding unnecessary embellishments.
Use Consistent Symbols and Color Themes
Consistency in symbols and colors helps in quickly conveying information and maintaining coherence throughout the diagram. Tools like Creately’s Business Diagram Software offer extensive options to maintain visual consistency.
Ensure Scalability and Flexibility
The diagram should be scalable and flexible to accommodate future changes or additions without losing clarity. This adaptability is crucial for diagrams that are used in ongoing projects or those that require regular updates.
Regular Updates and Maintenance
Tree diagrams, like any other tool, need to be updated regularly to reflect the most current data and insights. This practice prevents obsolescence and ensures the diagram remains a reliable tool for decision-making.
Use Tree Diagrams for Better Decision-Making
Tree diagrams are more than just visual aids; they are essential instruments for organizing complex data and optimizing decision-making processes. From simplifying data presentation to aiding in complex decision-making scenarios, tree diagrams provide a structured way to view problems and solutions.
Tree diagrams, with their hierarchical structure, are particularly beneficial in fields ranging from business analytics to educational frameworks, where they help clarify and distill complex information into manageable parts. This adaptability not only makes them invaluable in professional settings but also underscores their utility in personal and academic projects.
For those looking to implement these powerful tools, Creately offers extensive resources and templates to get started with tree diagrams. Whether you are a project manager needing to outline a new initiative or a researcher categorizing data findings, Creately’s platform facilitates the creation and sharing of tree diagrams with ease, enhancing collaborative efforts and ensuring clarity in projects.