The first step towards streamlining your work processes is identifying what’s slowing them down. There are many process improvement methodologies to identify bottlenecks and inefficiencies in your processes.
This guide gives a quick overview of each of the process improvement techniques. We’ll do deep dives on each subsequently in this series.
“A rule of thumb is that a lousy process will consume ten times as many hours as the work itself requires.”
-Bill Gates
Here we list down the most effective ones that you can easily make use of. Scroll down to find out,
Lean tools
Six Sigma Tools
Other
Lean Tools
Lean tools are used to eliminate wasteful process steps or activities that do not add any value.
The 8 types of waste you’ll be able to remove with the following Lean tools are
- Defects
- Overproduction
- Waiting
- Non-utilized talent
- Transportation
- Inventory
- Motion
- Extra-processing
Getting rid of these wasteful steps in your processes will help you improve product quality, reduce lead time and reduce total cost.
Here are 3 Lean tools that you can use to improve your business processes.
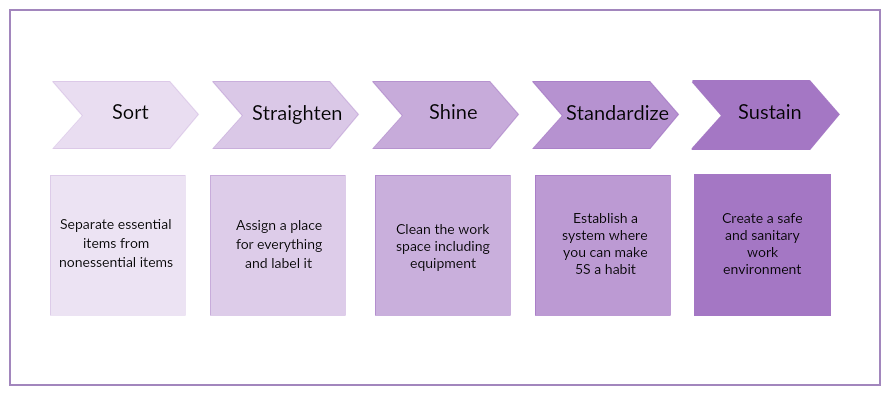
5S
An organized office environment is essential to efficient processes. With the 5S methodology, you can create a clean, safe, and productive environment for your team.
Generally used in:
All types of industries, from manufacturing to small businesses
Useful for:
- promoting safety
- lowering costs
- increasing process/team efficiency
- driving out waste from manufacturing processes
Documentation:
- Photographs (of workspaces before and after implementing 5S)
- Team activity documents or checklists
- Evaluation forms to check the status of the first 3 steps
- List of guidelines to keep the office organized and clean
Ease of use:
As it does not require any technical analysis, it can be used by everyone at work
How to use:
Here are the steps you need to follow when implementing 5S
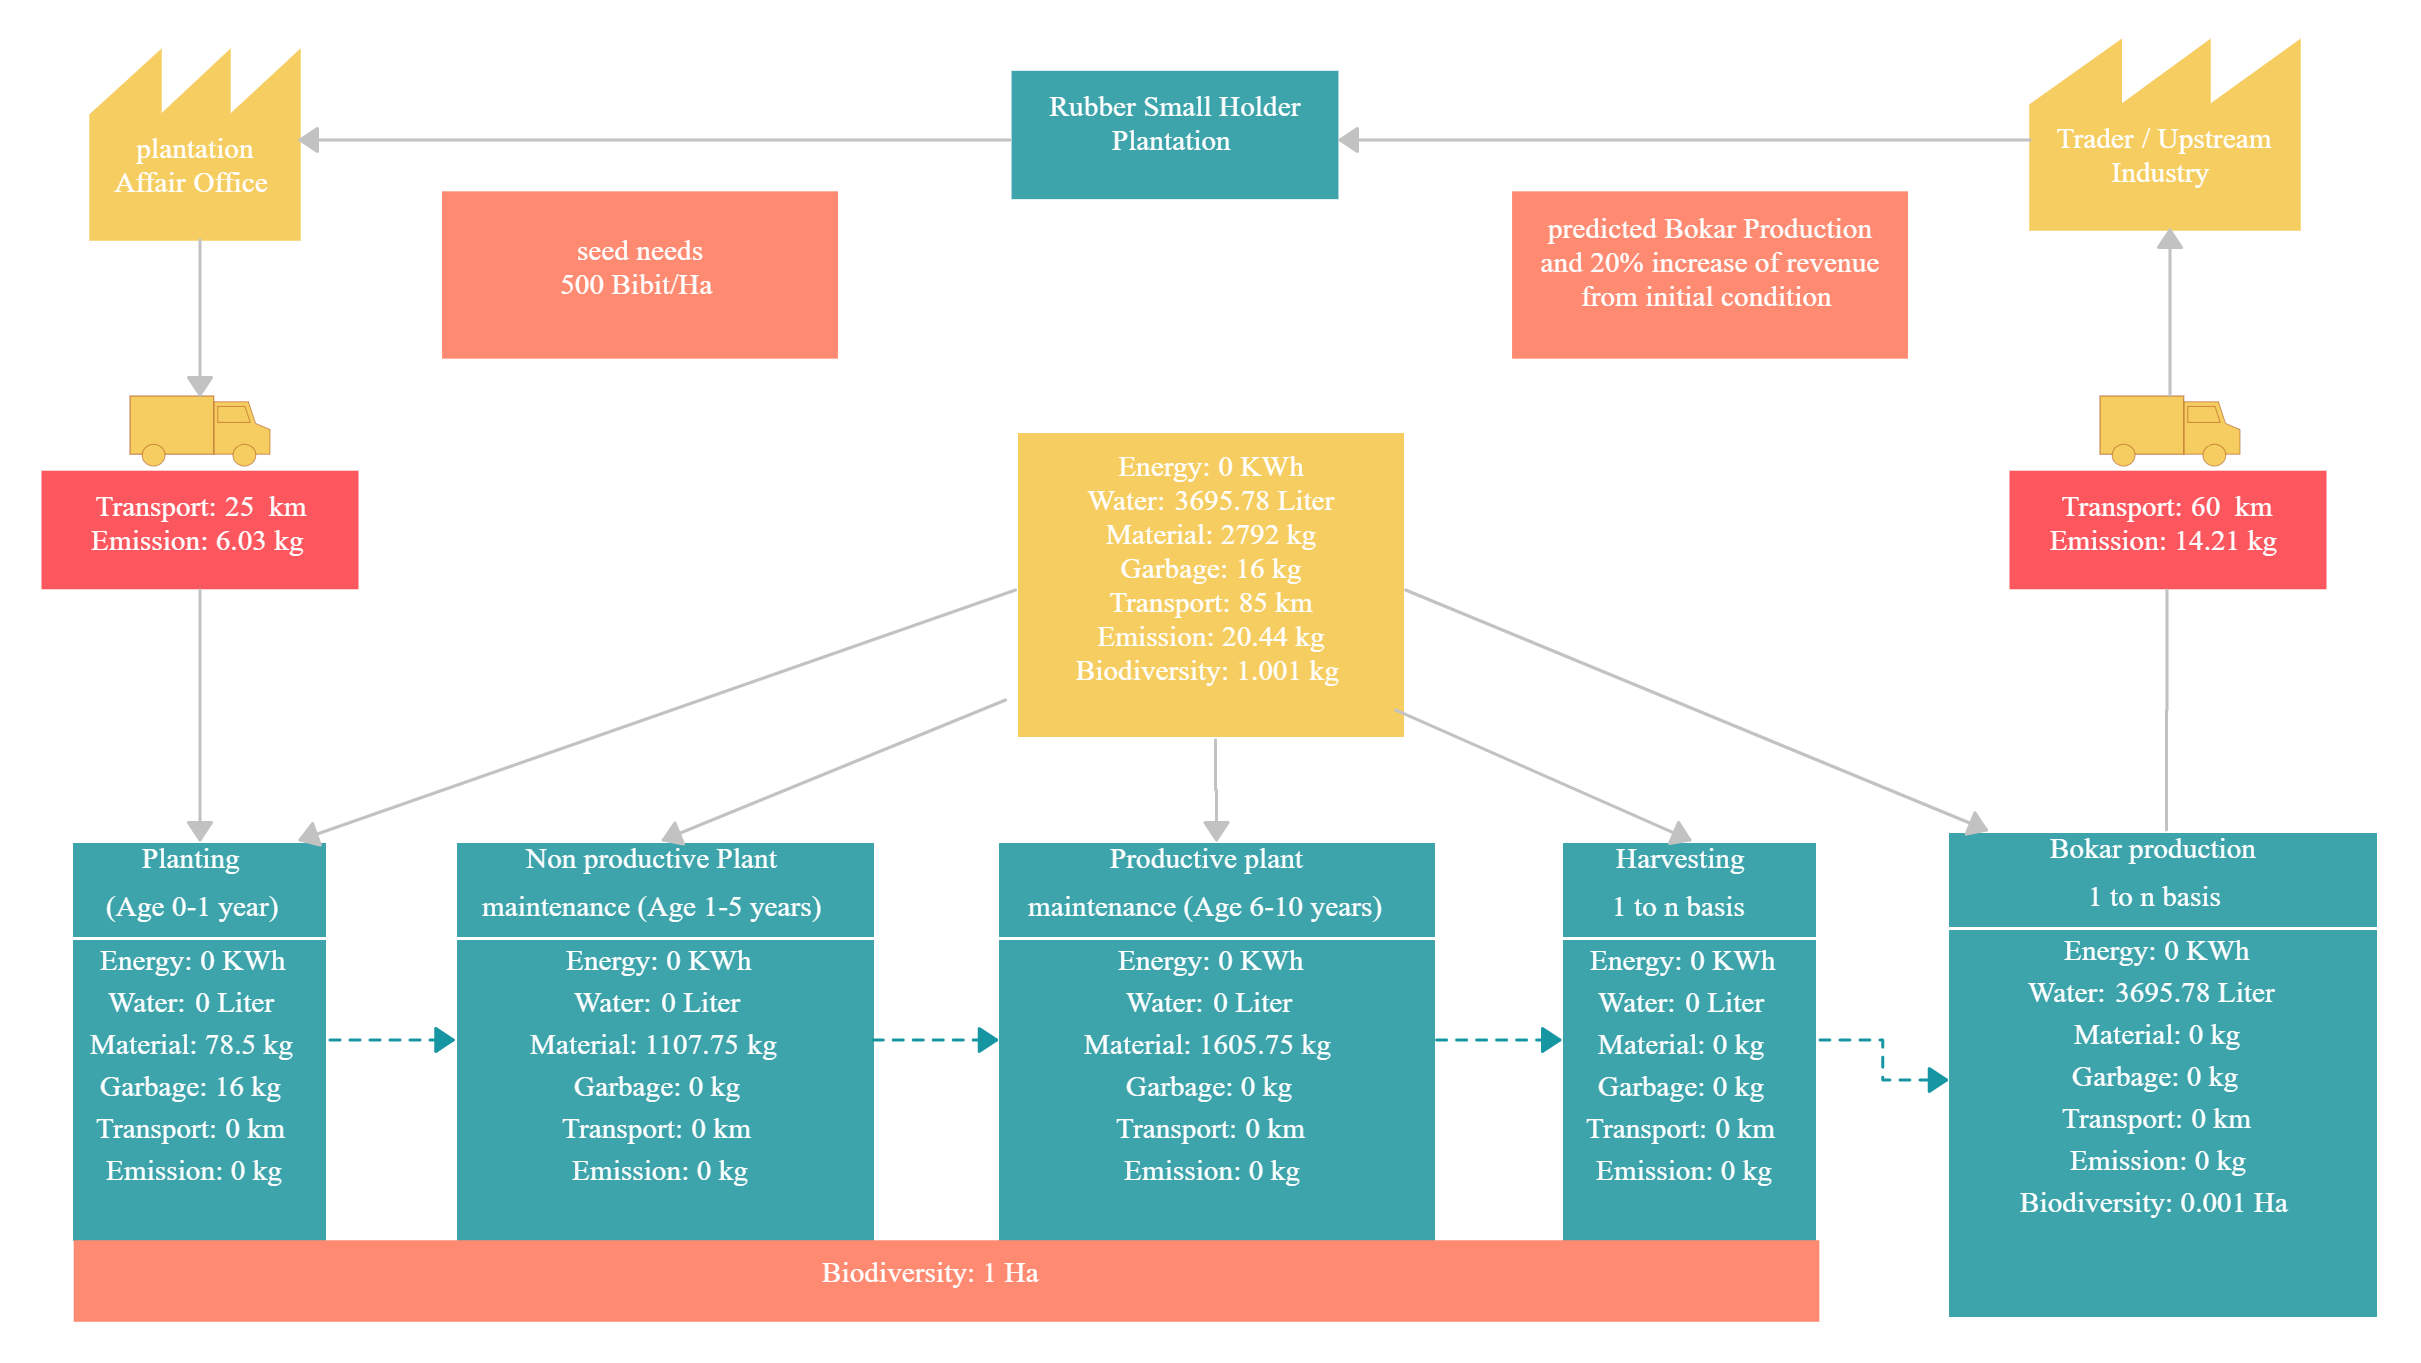
Value Stream Mapping
A value stream map is a graphical representation of the flow of materials and information that are needed to bring your product or service to your customer.
Generally used in:
Manufacturing industry
Useful for:
- Identifying waste within and between processes
- Gaining insight into the decision-making and the process flows
- Identifying and prioritizing areas for improvement
- Setting measurable goals for improvement tasks
Documentation:
- Current state map showing how you serve your customers at present
- Future-state map showing how the process will look like once the changes are made
Ease of use:
The mapping process can take up to 3 days to complete, but with the right team, it can be done faster.
How to use:
Check out this quick guide to value stream mapping to get started.
Need more free value stream map templates that you can edit?
Kaizen
Kaizen is a technique that calls for the constant improvement of every function of your business. It can be implemented through the PDCA cycle.
Generally used in:
Management departments, but also by those in quality control circles, waste disposal analyzers and common workers
Useful for:
- Improving processes, quality of products/ services and customer satisfaction
- Improving team productivity and job satisfaction
- Promoting better safety and faster delivery
Documentation:
- Reports of the current situation of the workplace
- Surveys to check the team’s attitude towards job satisfaction
- Kaizen strategy plan aiming to improve team productivity
Ease of use:
It’s an ongoing process and requires the active contribution of the entire company
How to use:
Follow the steps below in each stage of the cycle for optimal results.
Six Sigma Tools
Six Sigma is simply a smarter way to manage a business. It’s about collecting data on processes to understand what’s happening. This data is then analyzed and interpreted to find effective ways to improve the process. By doing so you get to
- Increase customer satisfaction
- Reduce cycle time
- Reduce defects
Let’s look at a few six sigma tools that are widely used to improve processes in businesses.
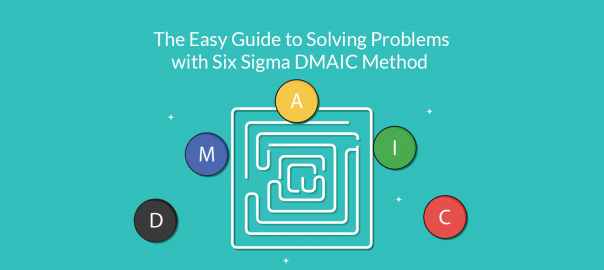
DMAIC
DMAIC is a 5-step method (a direct descendant of the Plan-Do-Check-Act Cycle) that is used to improve current processes.
If your products/ services or business processes aren’t meeting your customer expectations or not performing well, DMAIC can help you figure out why and find long-term solutions to the problem.
Generally used in:
All types of industries, especially by teams working on projects
Useful for:
- Improving processes or products
- Finding solutions for problems within processes
- Cutting excess costs and time
Documentation:
- Project charter
- Process map with process inputs and outputs
- Data on the performance of the project
- Documentation of the new solution
Ease of use:
It can be rolled out in a matter of month or over the course of a year
How to use:
Following are the steps you should take to implement the DMAIC method.
DMADV
DMADV, also known as Design for Six Sigma (DFSS) is used to create new processes at Six Sigma quality level.
If your existing processes do not meet the required quality levels even after they have been optimized, it’s time to do a DMADV to bring about an evolutionary change. Or in other words, create a new and better process.
Generally used in:
All types of industries, especially in manufacturing
Useful for:
- Developing a new process/ product
- Reducing the errors in a product line
- Improving customer satisfaction
- Increasing profits
Documentation:
- Information on historical process/ product data
- Customer feedback/ reviews
Ease of use:
This methodology can be rolled out over the course of several months or even years
How to use:
Follow these steps to implement DMADV
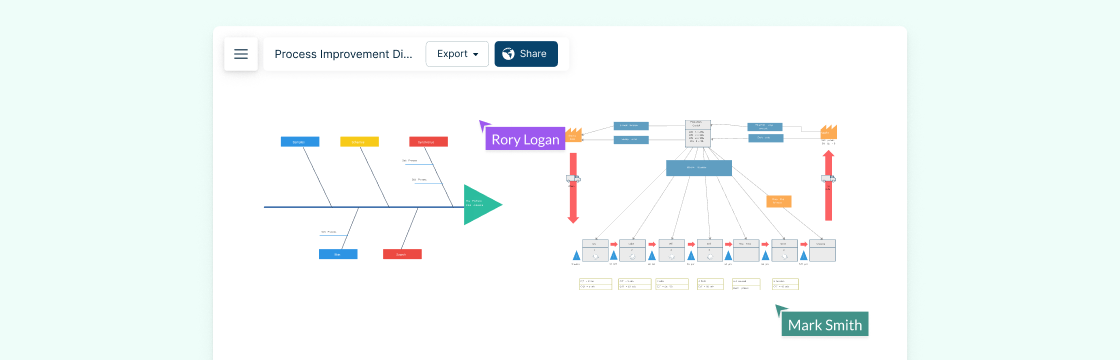
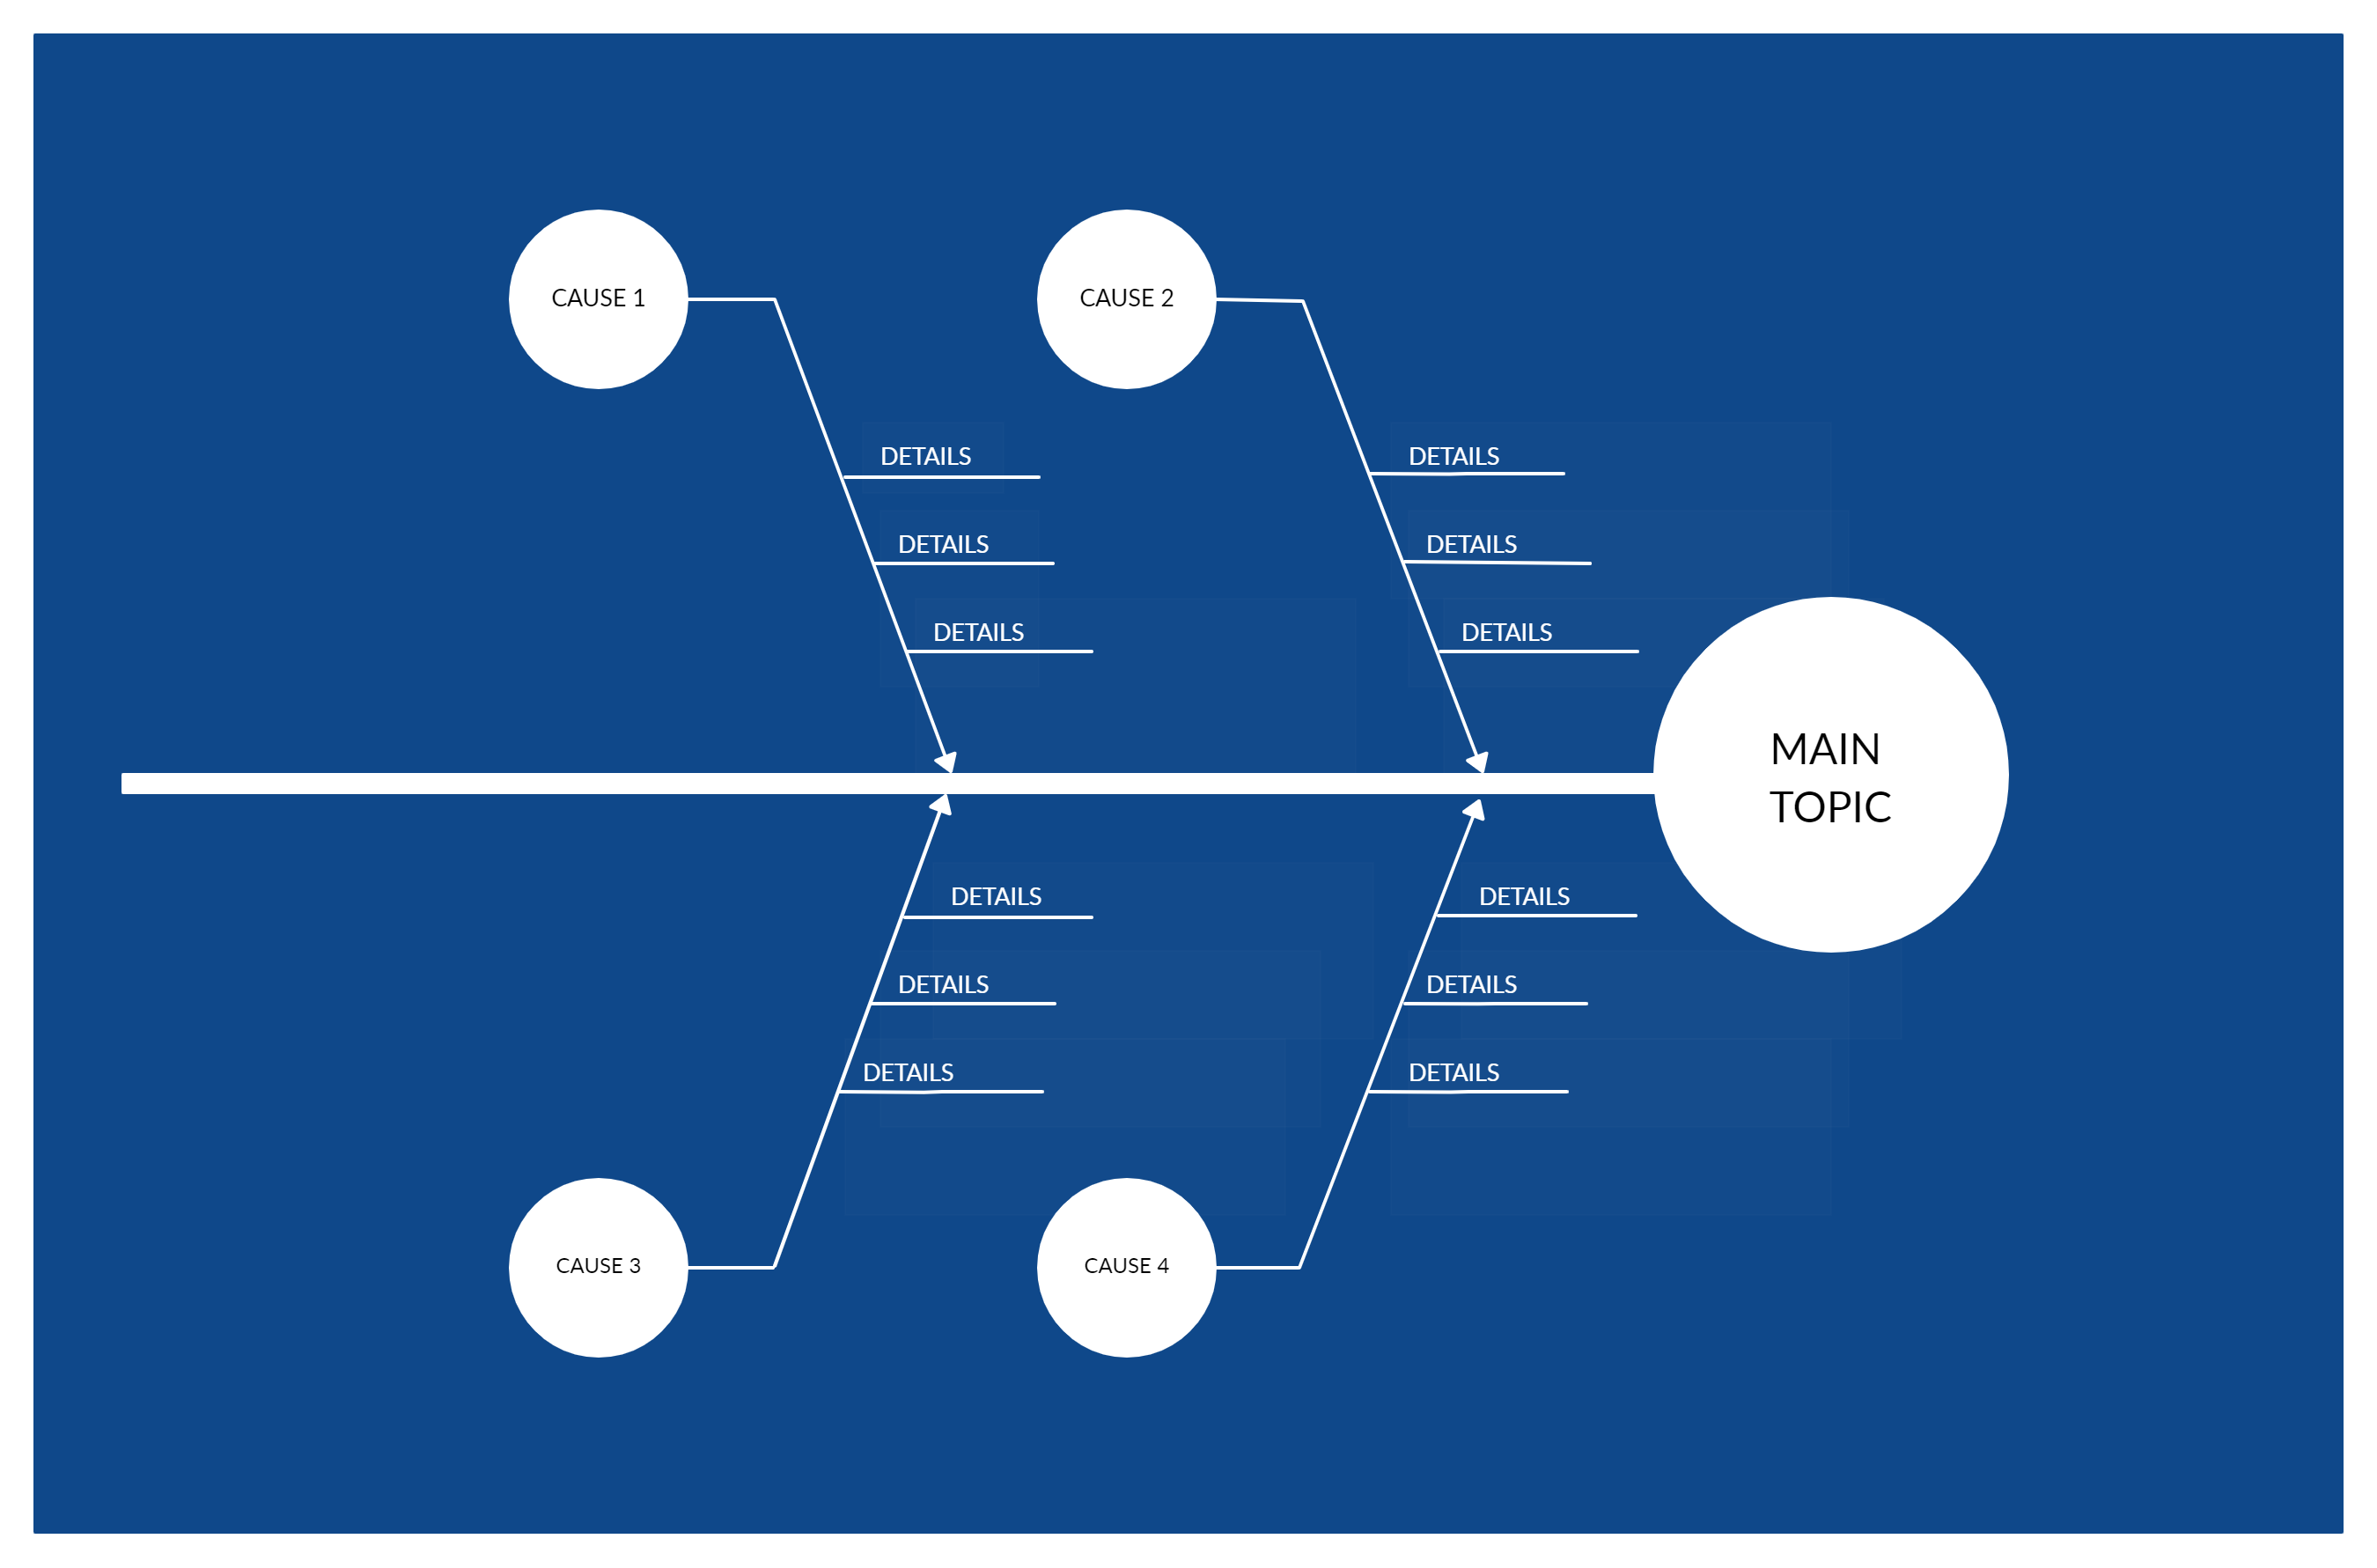
Cause and Effect Analysis
It’s also known as fishbone diagram or Ishikawa diagram. It is a technique that can be used to visually display the causes of a certain issue or effect.
Generally used in:
All types of industries
Useful for:
- Identifying and analyzing all possible causes for a problem/ effect
- Facilitating team problem-solving brainstorming sessions
Documentation:
Documents on information related to the issues that are being analyzed
Ease of use:
Can help a team identify and analyze causes of a problem in a single brainstorming session
How to use:
Here’s the ultimate guide to fishbone diagrams to help you get started.
Get more free fishbone diagram templates that you can quickly edit online.
SIPOC analysis
The SIPOC analysis is a technique that helps organize data on people and things that are involved in your business processes.
Generally used in:
Manufacturing industry
Useful for:
- Identifying all relevant elements needed for a process improvement project
- Define complex projects that are not properly scoped
- Understanding the process during the define phase of DMAIC
Documentation:
In the SIPOC analysis you’ll be listing data under each of these following categories, and therefore you’ll need information on them.
- Supplier: the people, departments, organizations etc. that provide you the input needed to carry out a process
- Input: raw material, equipment, forms or information and even people that are needed to carry out a process
- Process: a graphic of the process steps
- Output: a list of things the process provides to the internal and external customer
- Customer: a list of internal and external customers who will be receiving your outputs
Ease of use:
The 5 columns are filled during a brainstorming session. As long as the relevant information is provided by the team, the diagram can be completed and analyzed quickly.
How to use:
Gather your team and list down the above information in a diagram/ table like the one below.
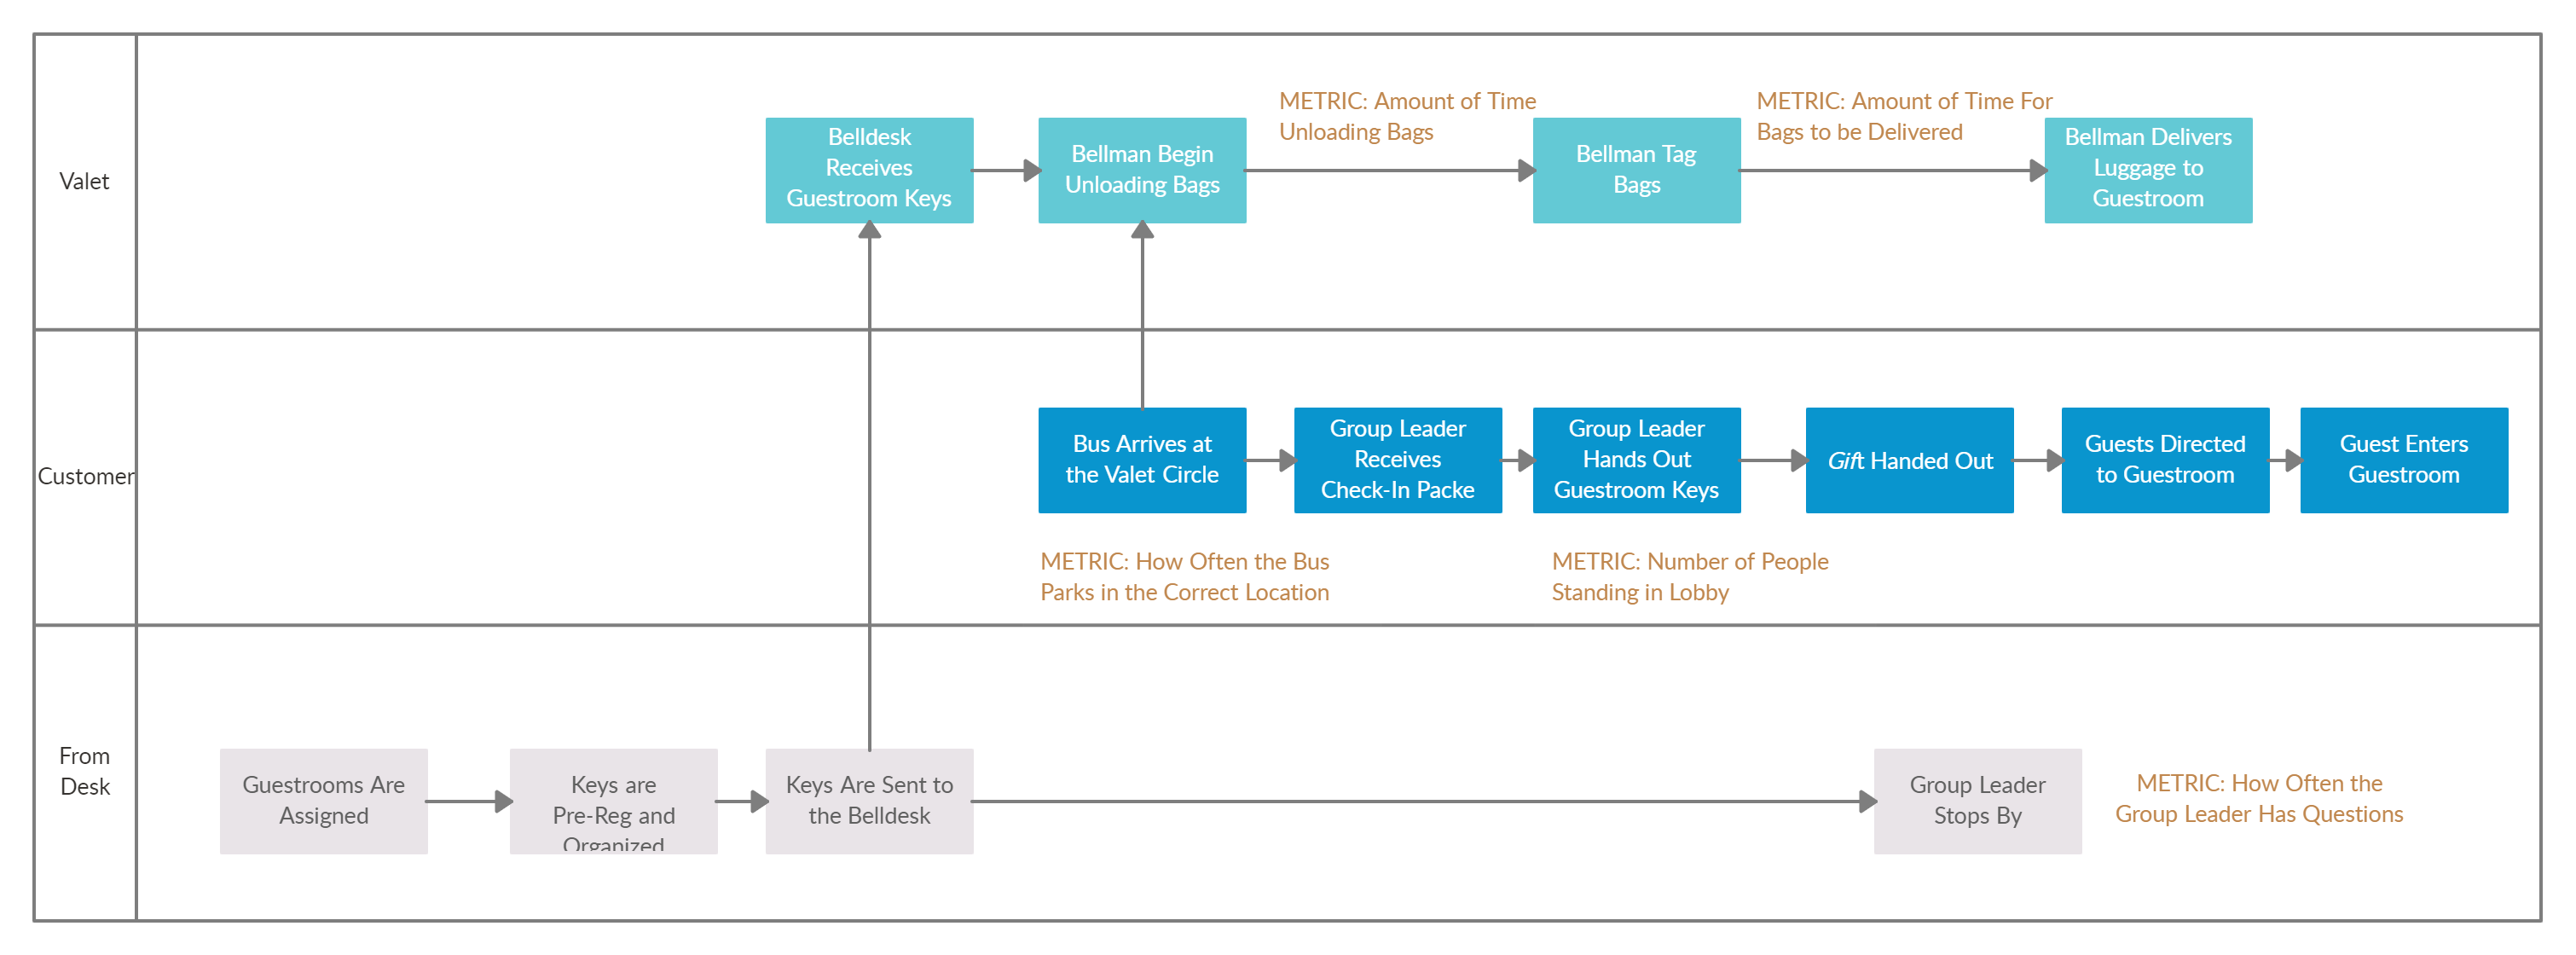
Process Maps
Process maps graphically represent each step of a process. And they are an essential part of process documentation.
Generally used in:
All types of industries, from manufacturing to marketing
Useful for:
- Understanding how processes work
- Identifying process areas that need change
Documentation:
- Information available on the process that is being mapped
- Job descriptions and responsibilities of those who are involved in the process
Ease of use:
To map a process, you need the participation of those who are involved. Gathering them in one place, mapping the process and analyzing it may span over a few days, especially if the process is complicated.
How to use:
Gather your team, brainstorm the process steps, identify process boundaries, put the steps in a sequential order, draw the process map and verify that the map is accurate.
Want to draw a process map/ flowchart? Use Creately flowchart software to get it done quickly!
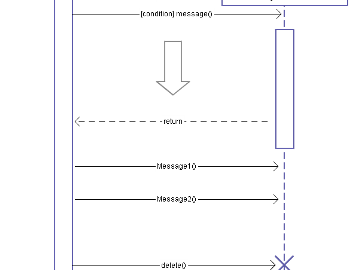
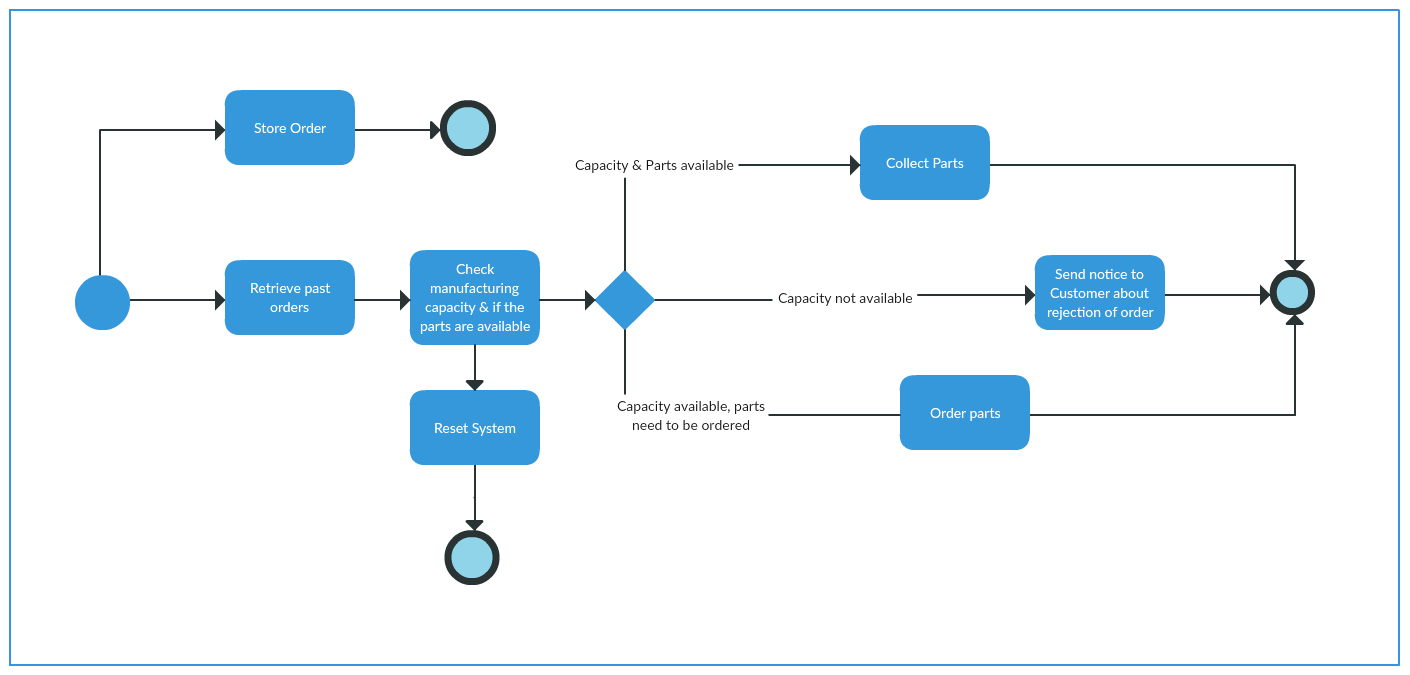
BPMN Process Maps
A Business Process Modeling Notation map is the standardized way to create visual models of your business processes.
Generally used in:
All types of industries, especially by business analysts
Useful for:
- Breaking down business processes for easy analysis
- Identifying errors within processes
- Designing entirely new processes
- Helping stakeholders understand how the business is run
Documentation:
Information on the inputs, outputs, etc. of the business process
Ease of use:
If you are familiar with the standards of BPMN, drawing the diagram can be done within a day, as long as you have a clear idea of how the process spans out.
Get more free BPMN templates that you can edit online.
Want to Expand the List of Business Process Improvement methodologies?
We’ve covered a number of handy business process improvement methodologies that you can use to streamline your workflow and increase your team’s productivity. Use them and share with us how they helped you reach your targets.
What other process improvement methodologies do you use?
In our next guide, we’ll look into more detail about process mapping, an essential business process improvement technique that’ll help you improve efficiency and cut costs.