So you want to learn Entity Relationship diagrams? This ER diagram tutorial will cover their usage, history, symbols, notations and how to use our ER diagram software to draw them. We’ve also added some templates for you to get started quickly.
What is an ER diagram?
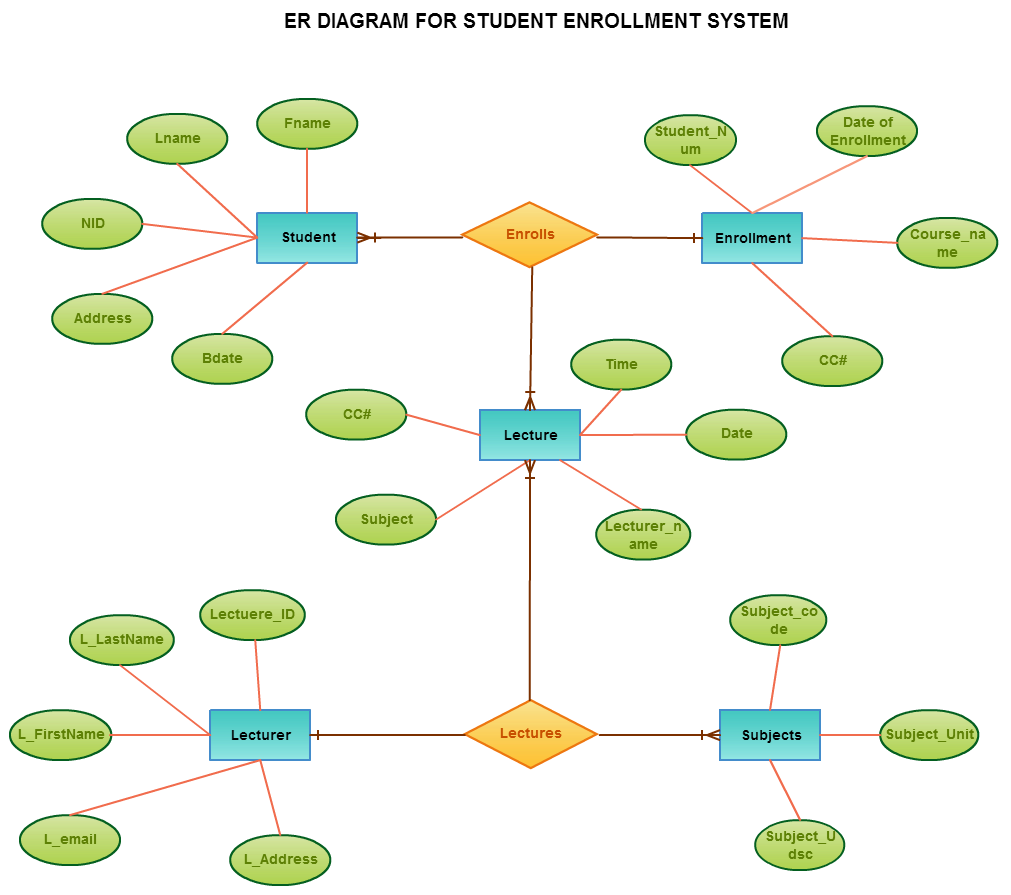
An Entity Relationship Diagram (ERD) is a visual representation of different entities within a system and how they relate to each other. It is a tool used to design and model relational databases, and shows the logical structure of the database. ER diagrams use symbols to represent entities, attributes, and relationships, which help to illustrate the relationships between the entities in the database. It consists of entities (which represent objects or concepts, like “Customer” or “Product”) and relationships (which represent how these entities are connected or interact with each other, like “owns” or “buys”).
Entities are depicted as rectangles, and relationships are shown as diamonds. Lines connecting entities and relationships represent the connections between them, often indicating the type of relationship (such as one-to-one, one-to-many, or many-to-many).
ER diagrams are commonly used in software engineering and database design to help developers and stakeholders understand and design complex databases. For example, the elements writer, novel, and a consumer may be described using ER diagrams the following way:
 Edit this Template
- Ready to use
- Fully customizable template
- Get Started in seconds
 Close
CloseHistory of ER Diagrams
ER diagrams were first introduced by a computer scientist named Peter Chen in 1976. He proposed them as a way to visually represent the structure of databases. During the late 1970s and early 1980s, ER diagrams became widely used in both academic and industrial settings. They provided a clear way to show how different pieces of information are related to each other.
As database systems became more complex, ER diagrams remained important tools for designing and managing databases. They helped developers and users understand how data was organized and connected.
In the 1990s and 2000s, with the rise of the internet and new technologies, ER diagrams adapted to accommodate these changes. They continued to be essential for designing databases, but they were sometimes used alongside other modeling techniques.
Today, ER diagrams are still widely used in software engineering and database design. They provide a simple and intuitive way to plan and communicate the structure of databases, making them valuable tools for developers and designers.
ER Diagram Templates
Below are some ER diagram templates so you can get started quickly. Clicking on the image and in the new page that opens click the “Use as Template” button. For more templates check our ER diagram template section.
 Edit this Template
- Ready to use
- Fully customizable template
- Get Started in seconds
Close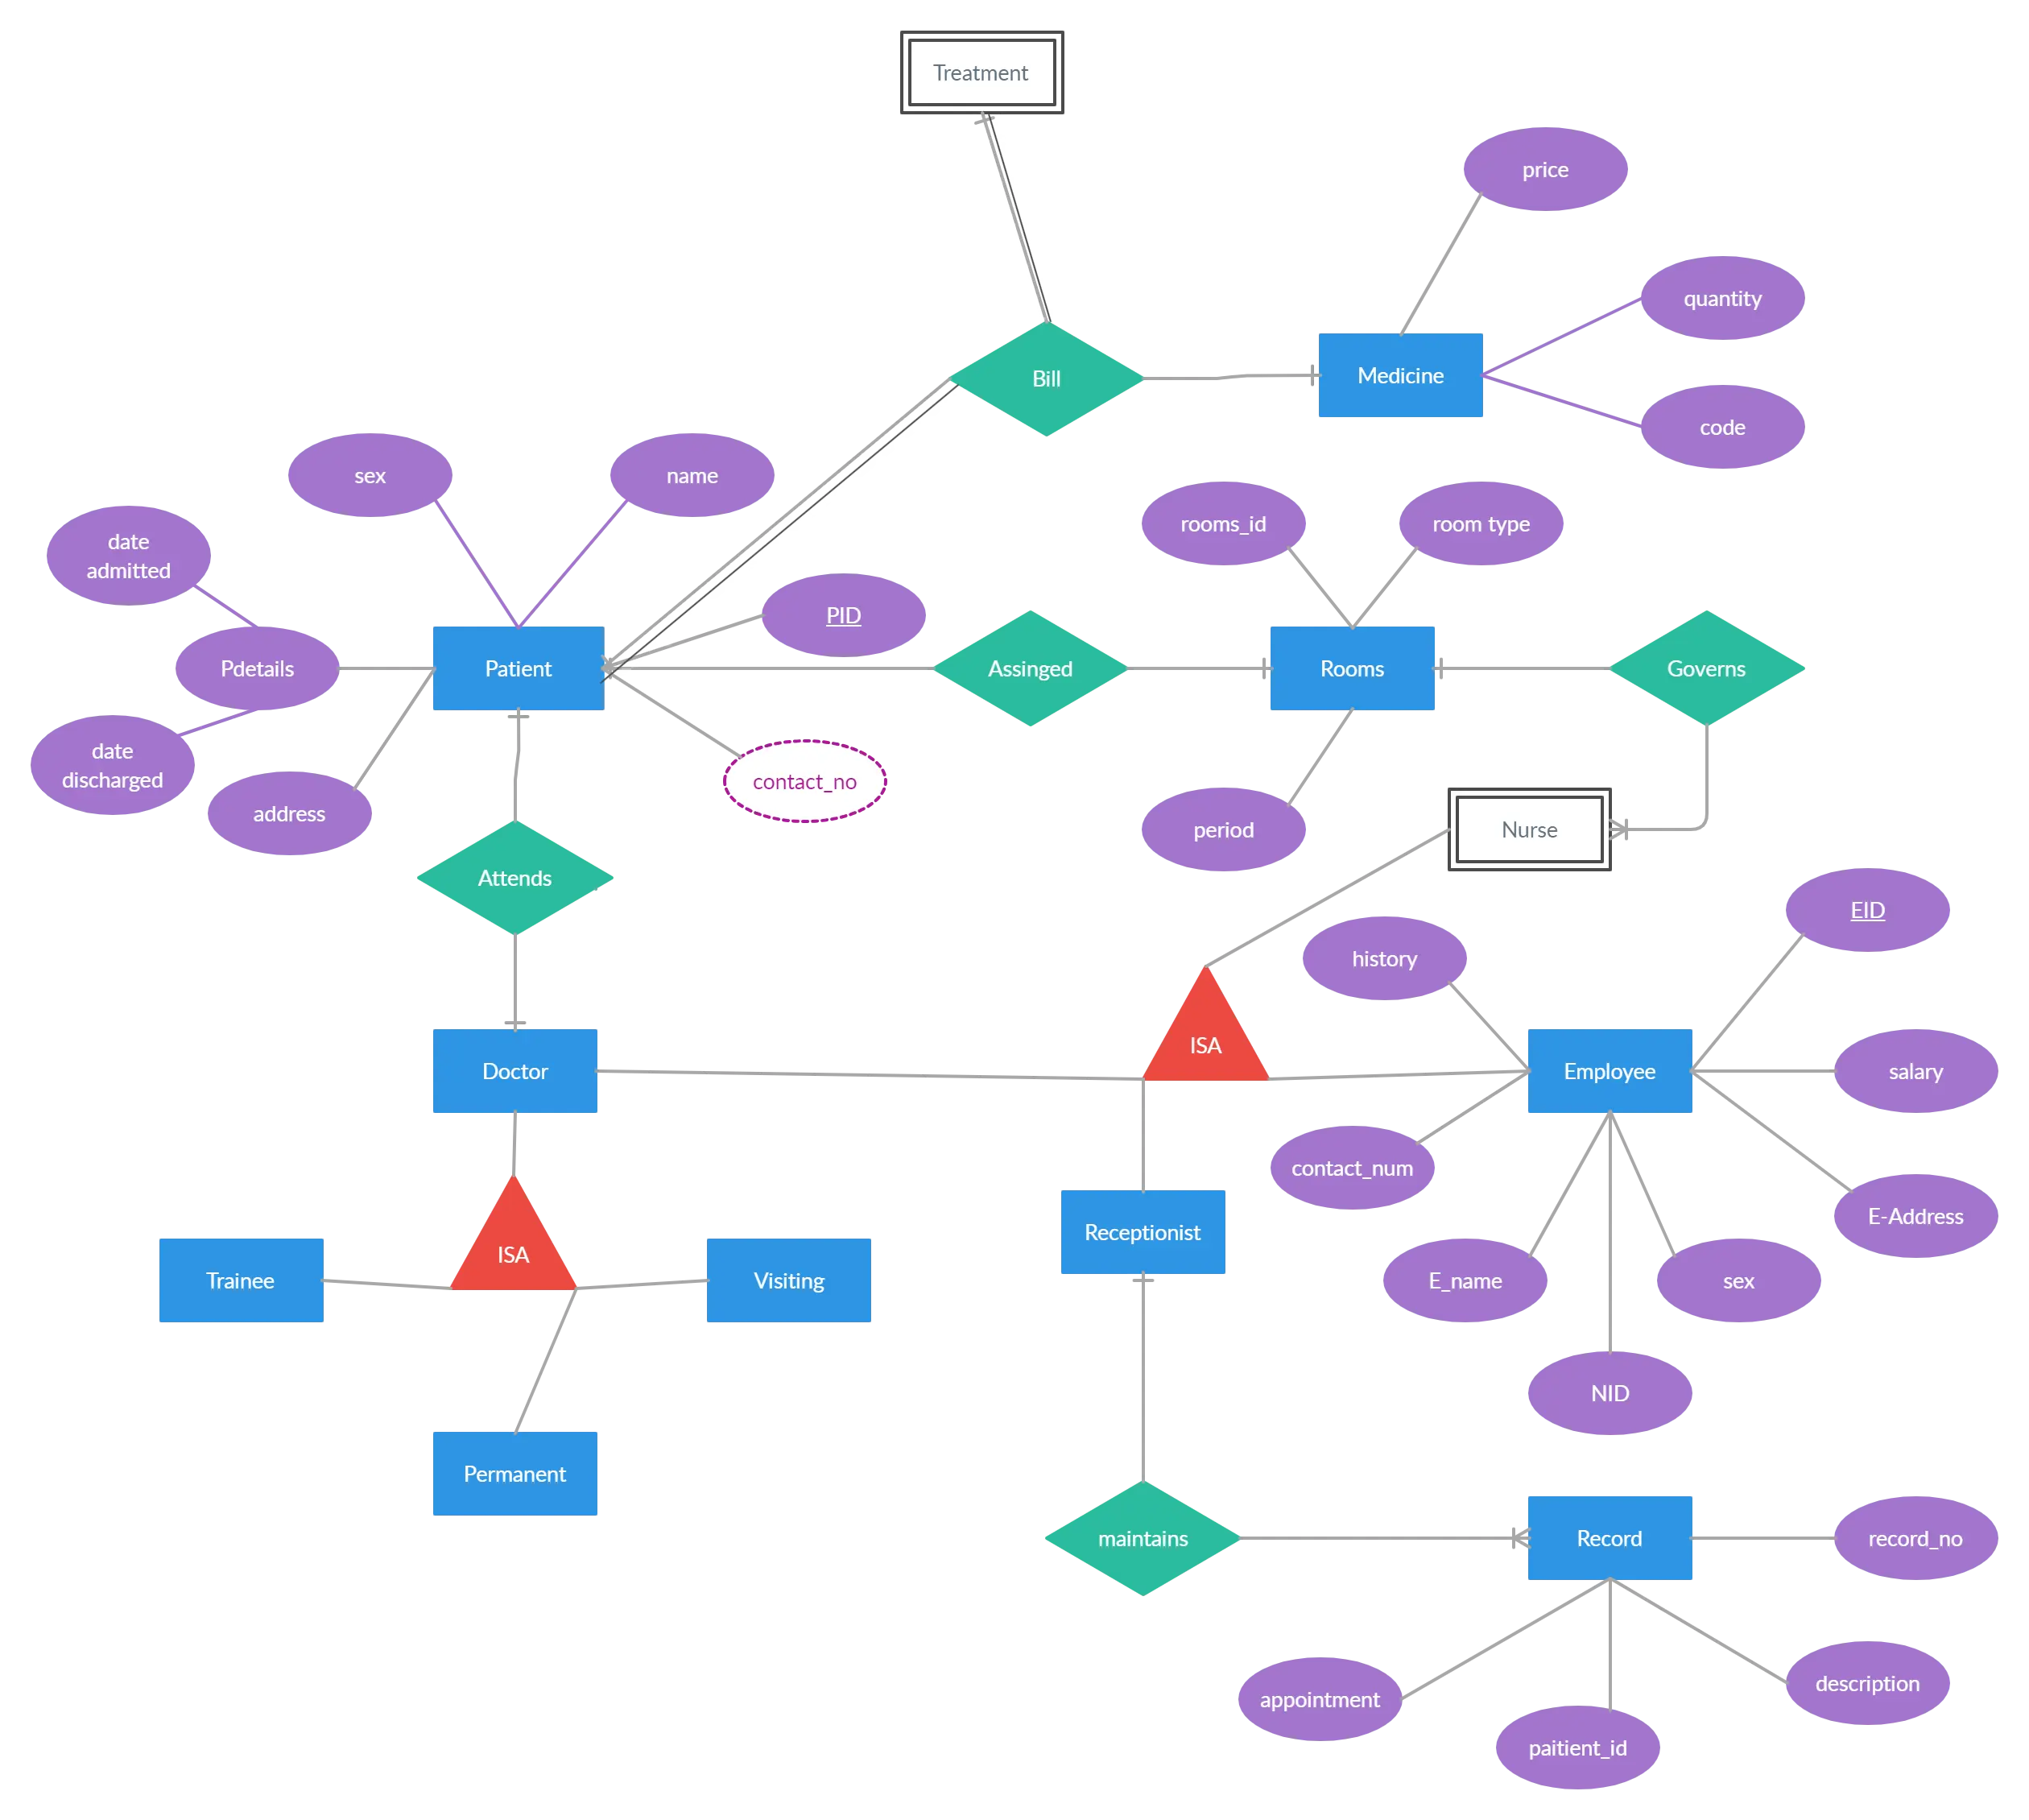 Edit this Template
- Ready to use
- Fully customizable template
- Get Started in seconds
Close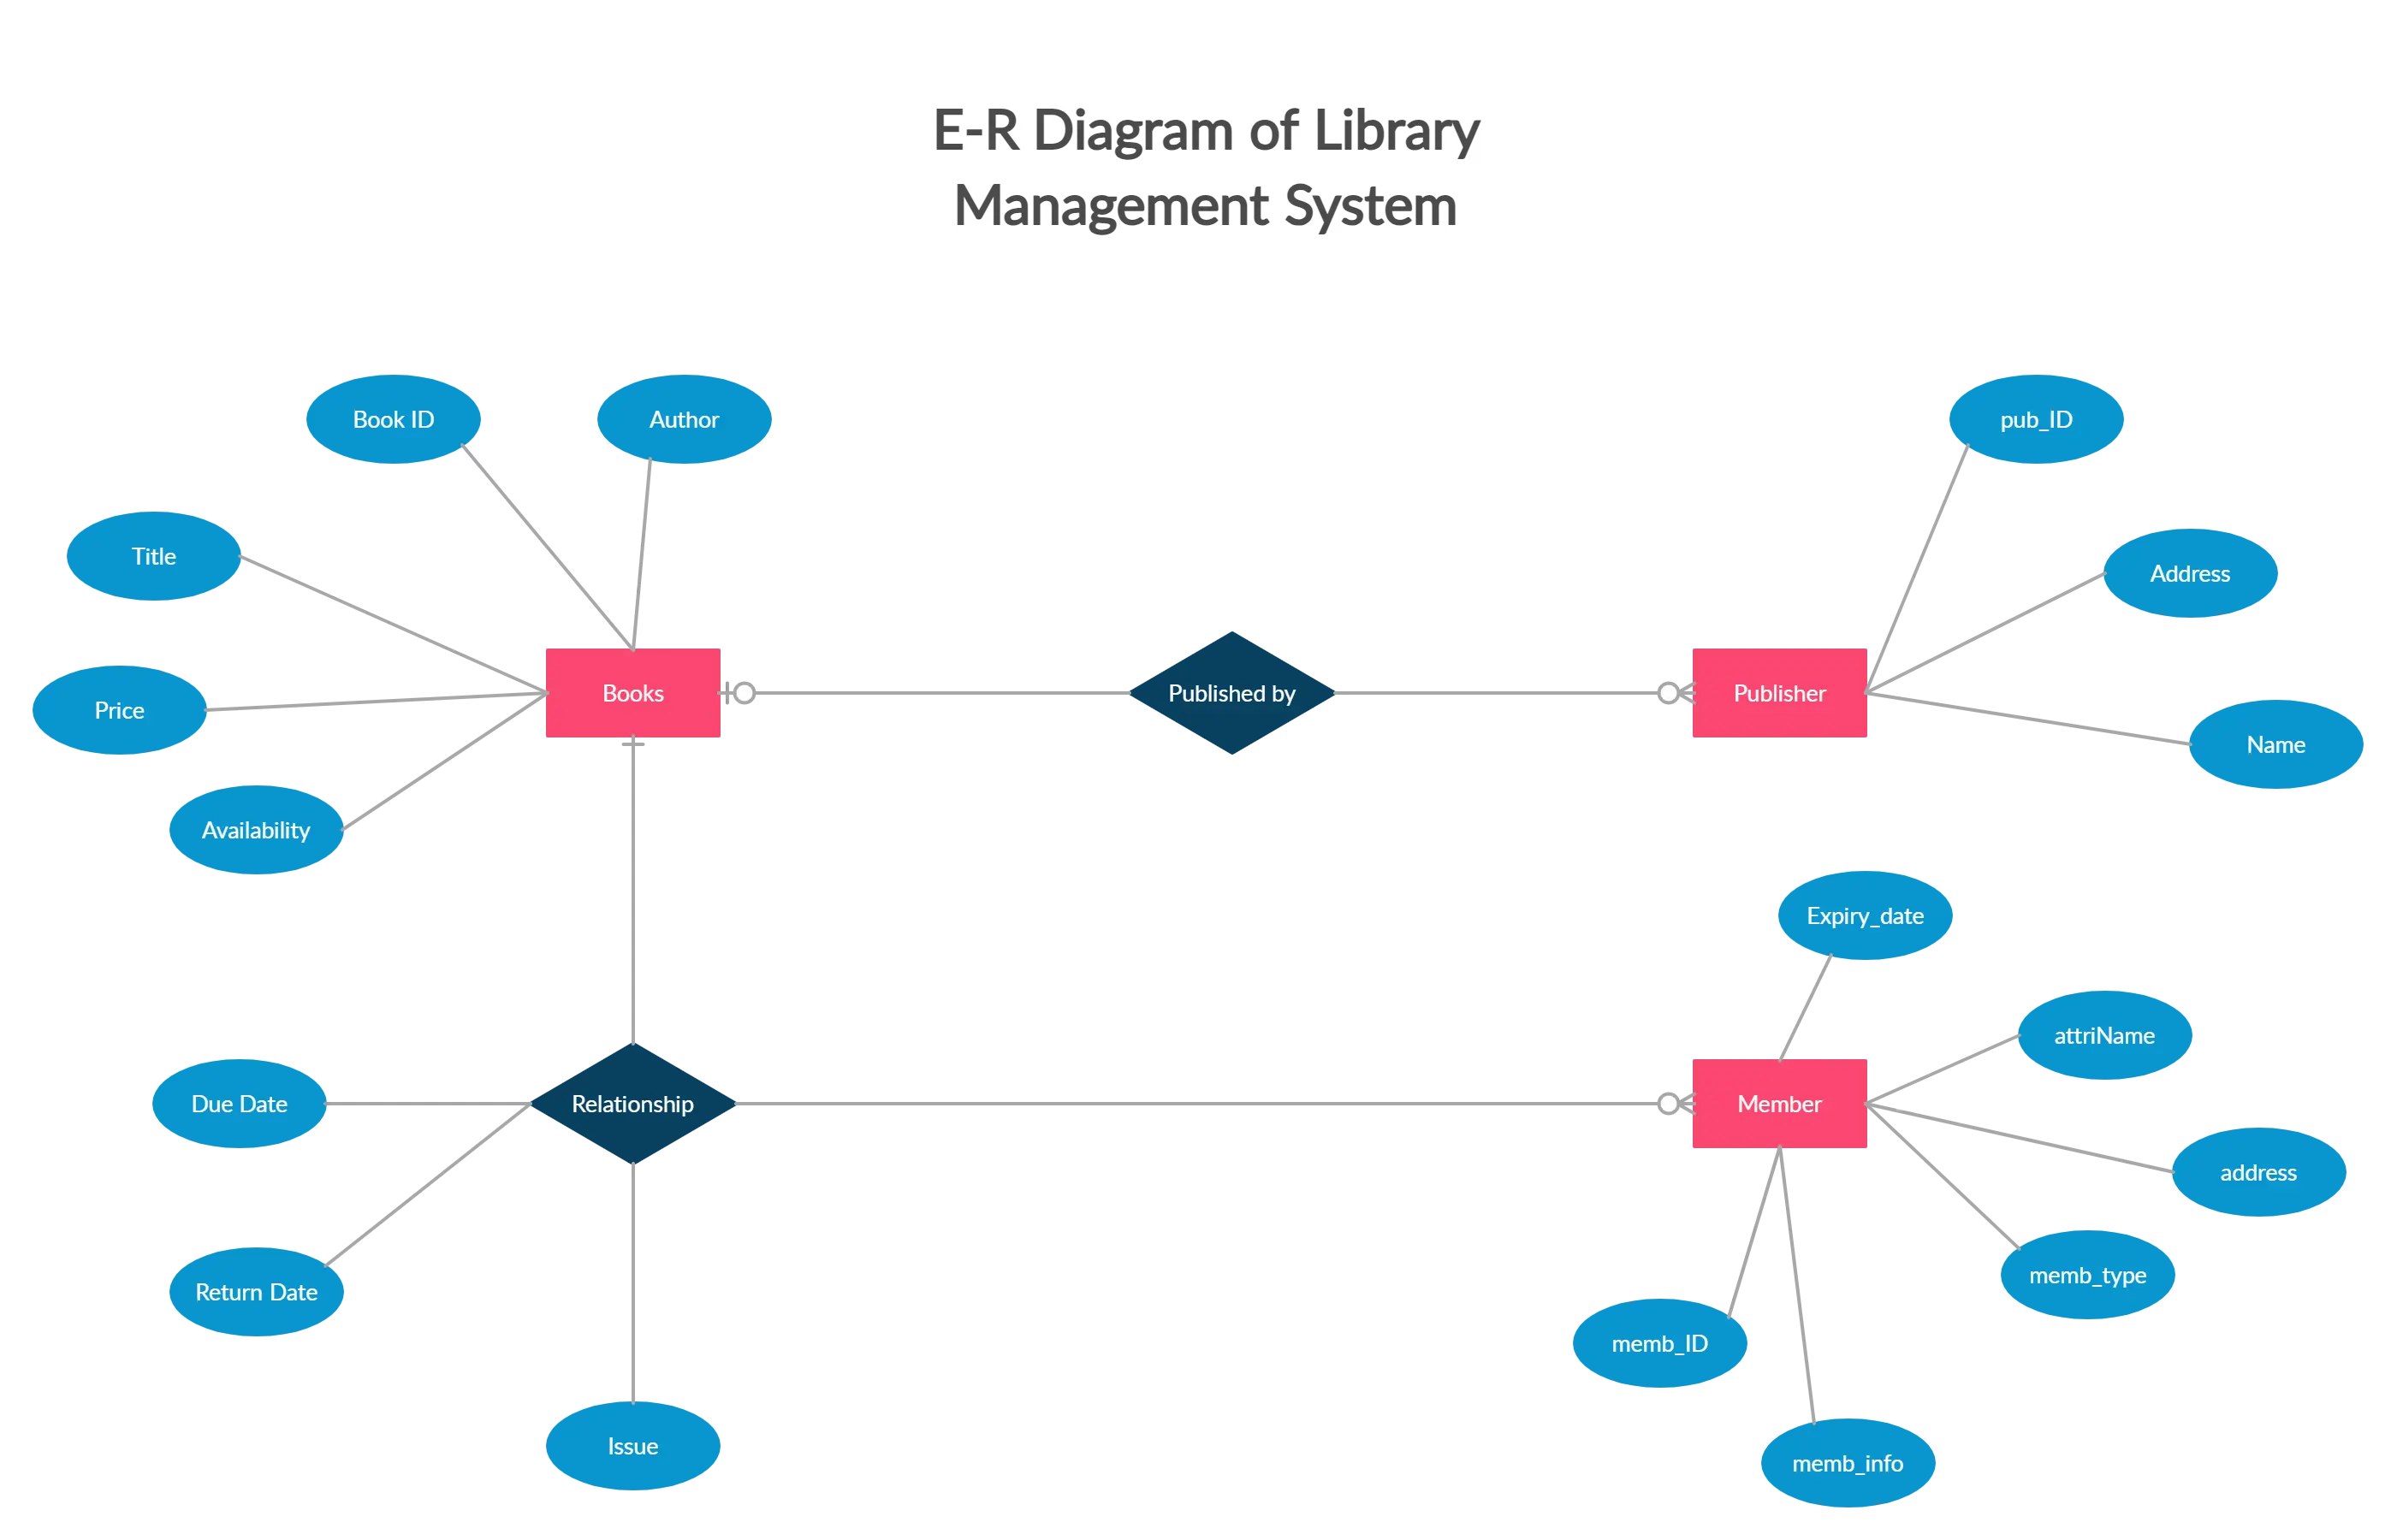 Edit this Template
- Ready to use
- Fully customizable template
- Get Started in seconds
Close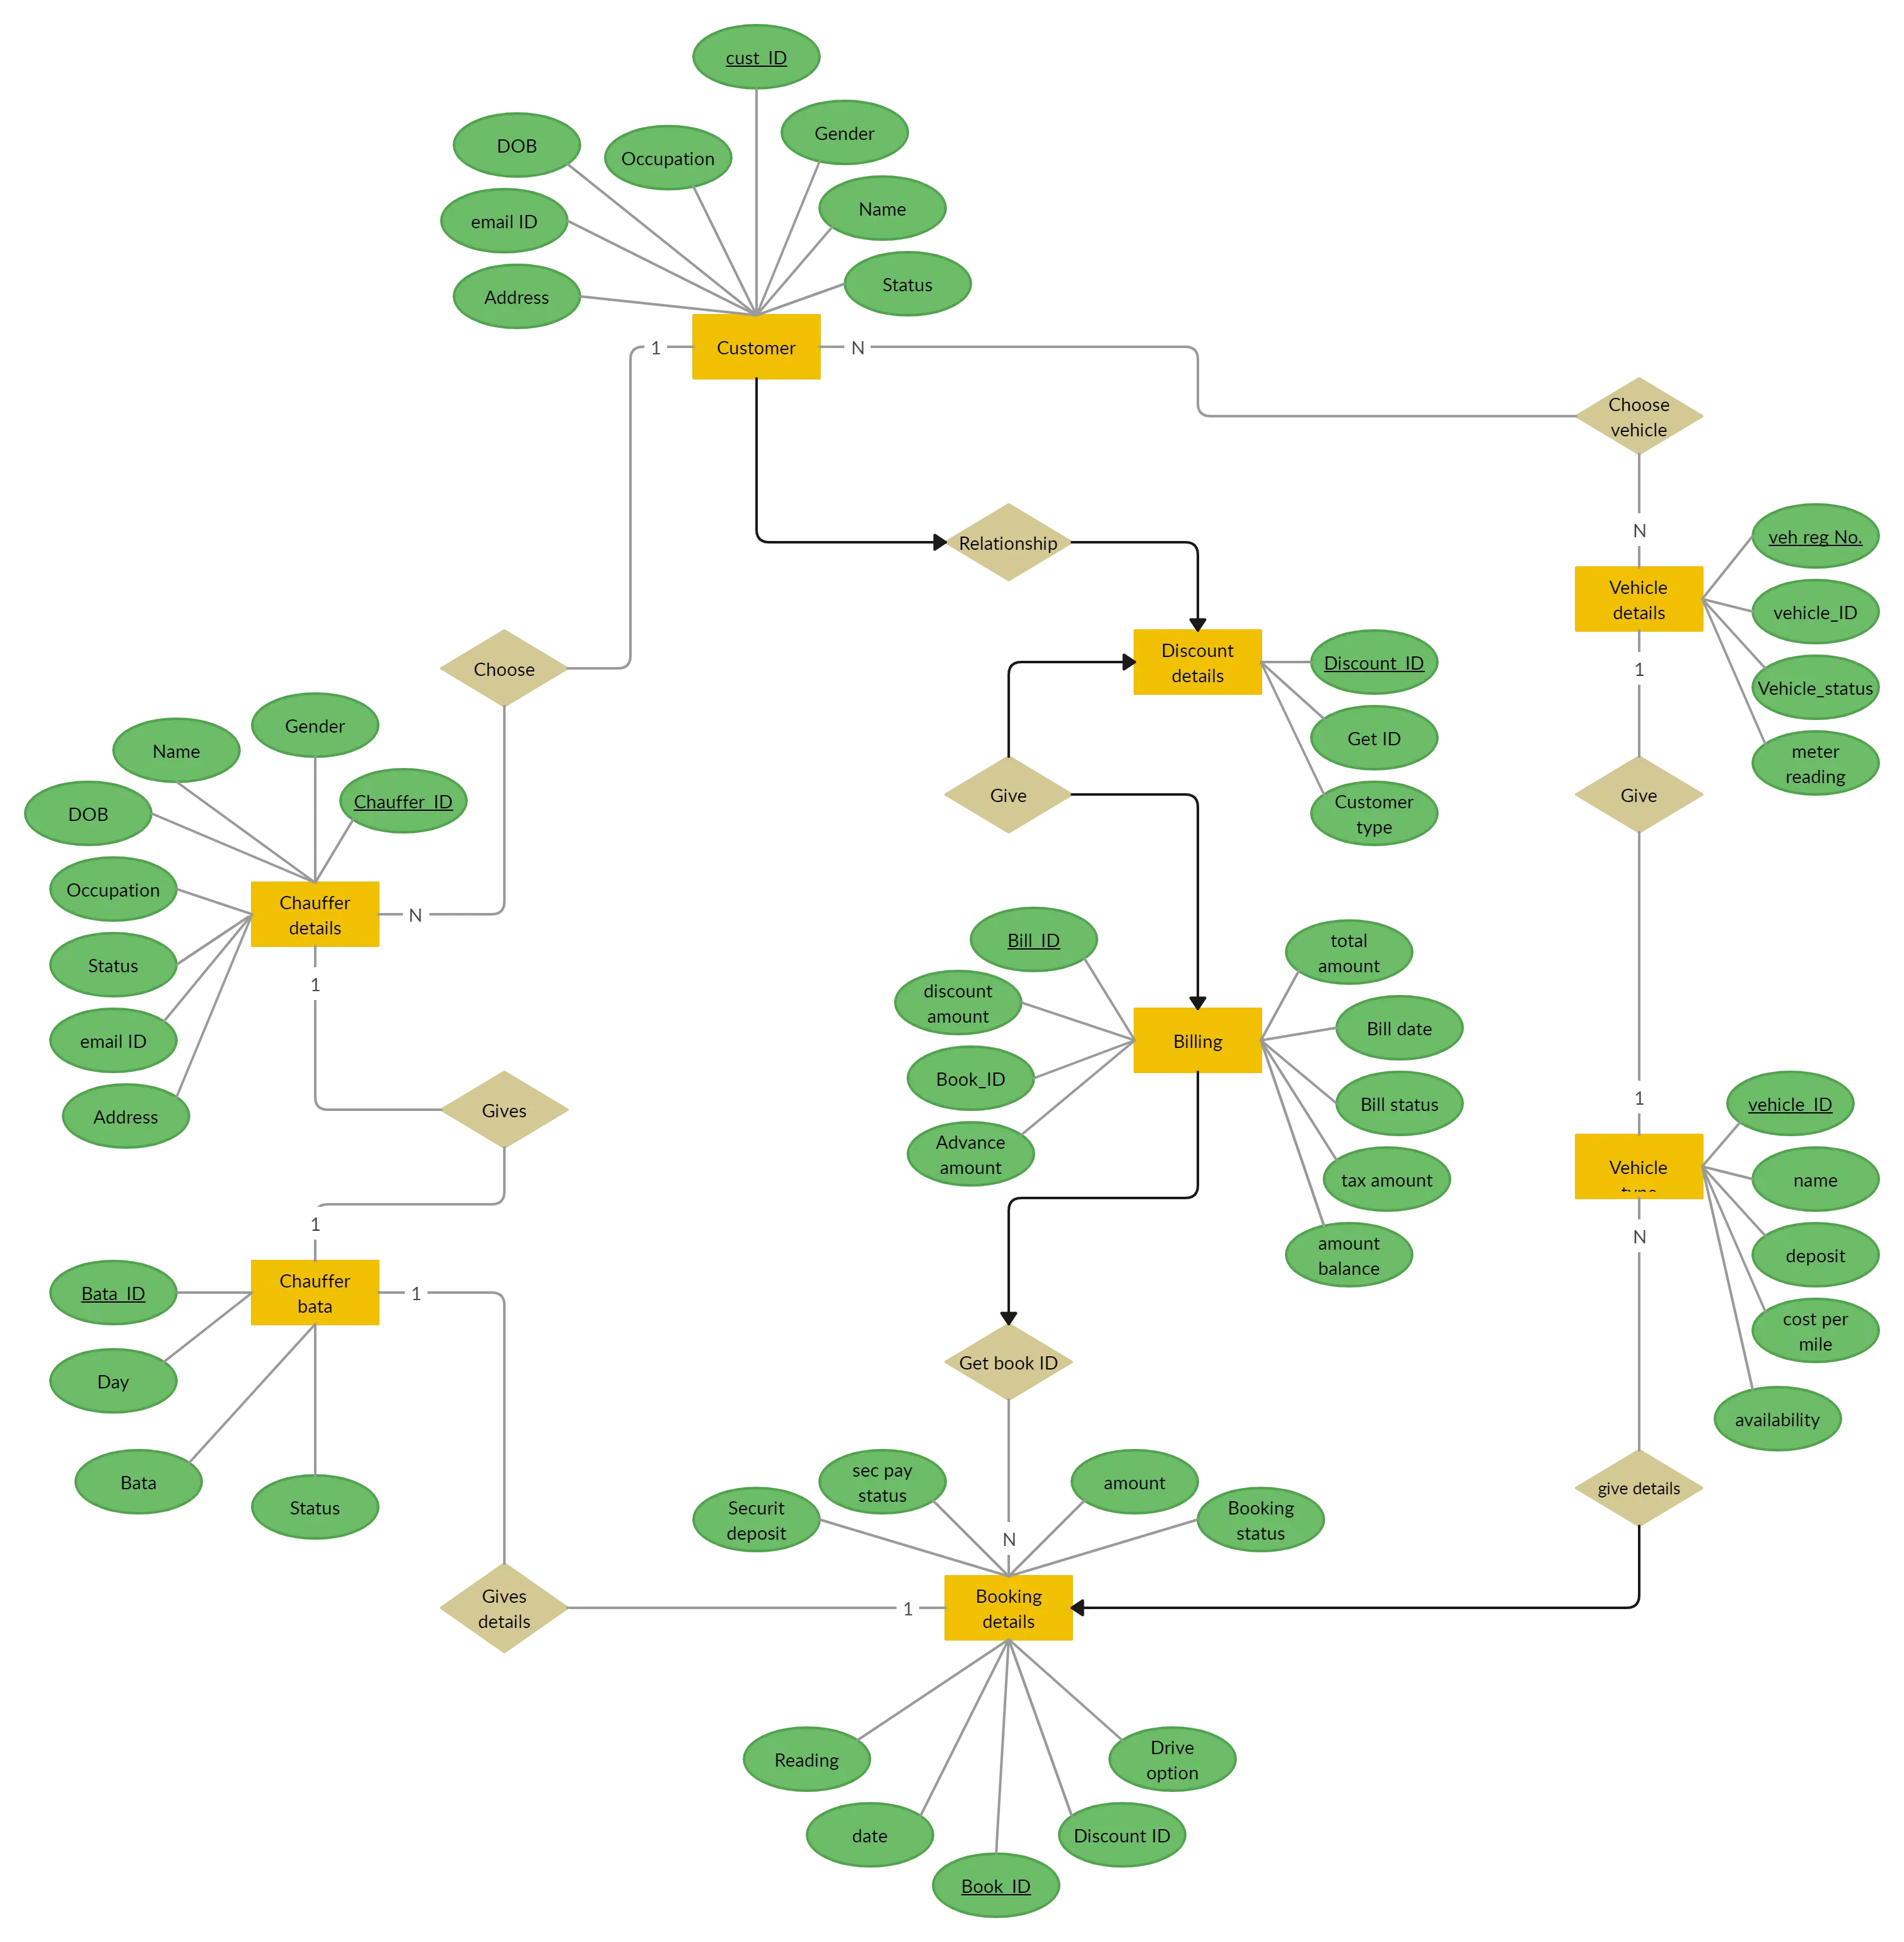 Edit this Template
- Ready to use
- Fully customizable template
- Get Started in seconds
Close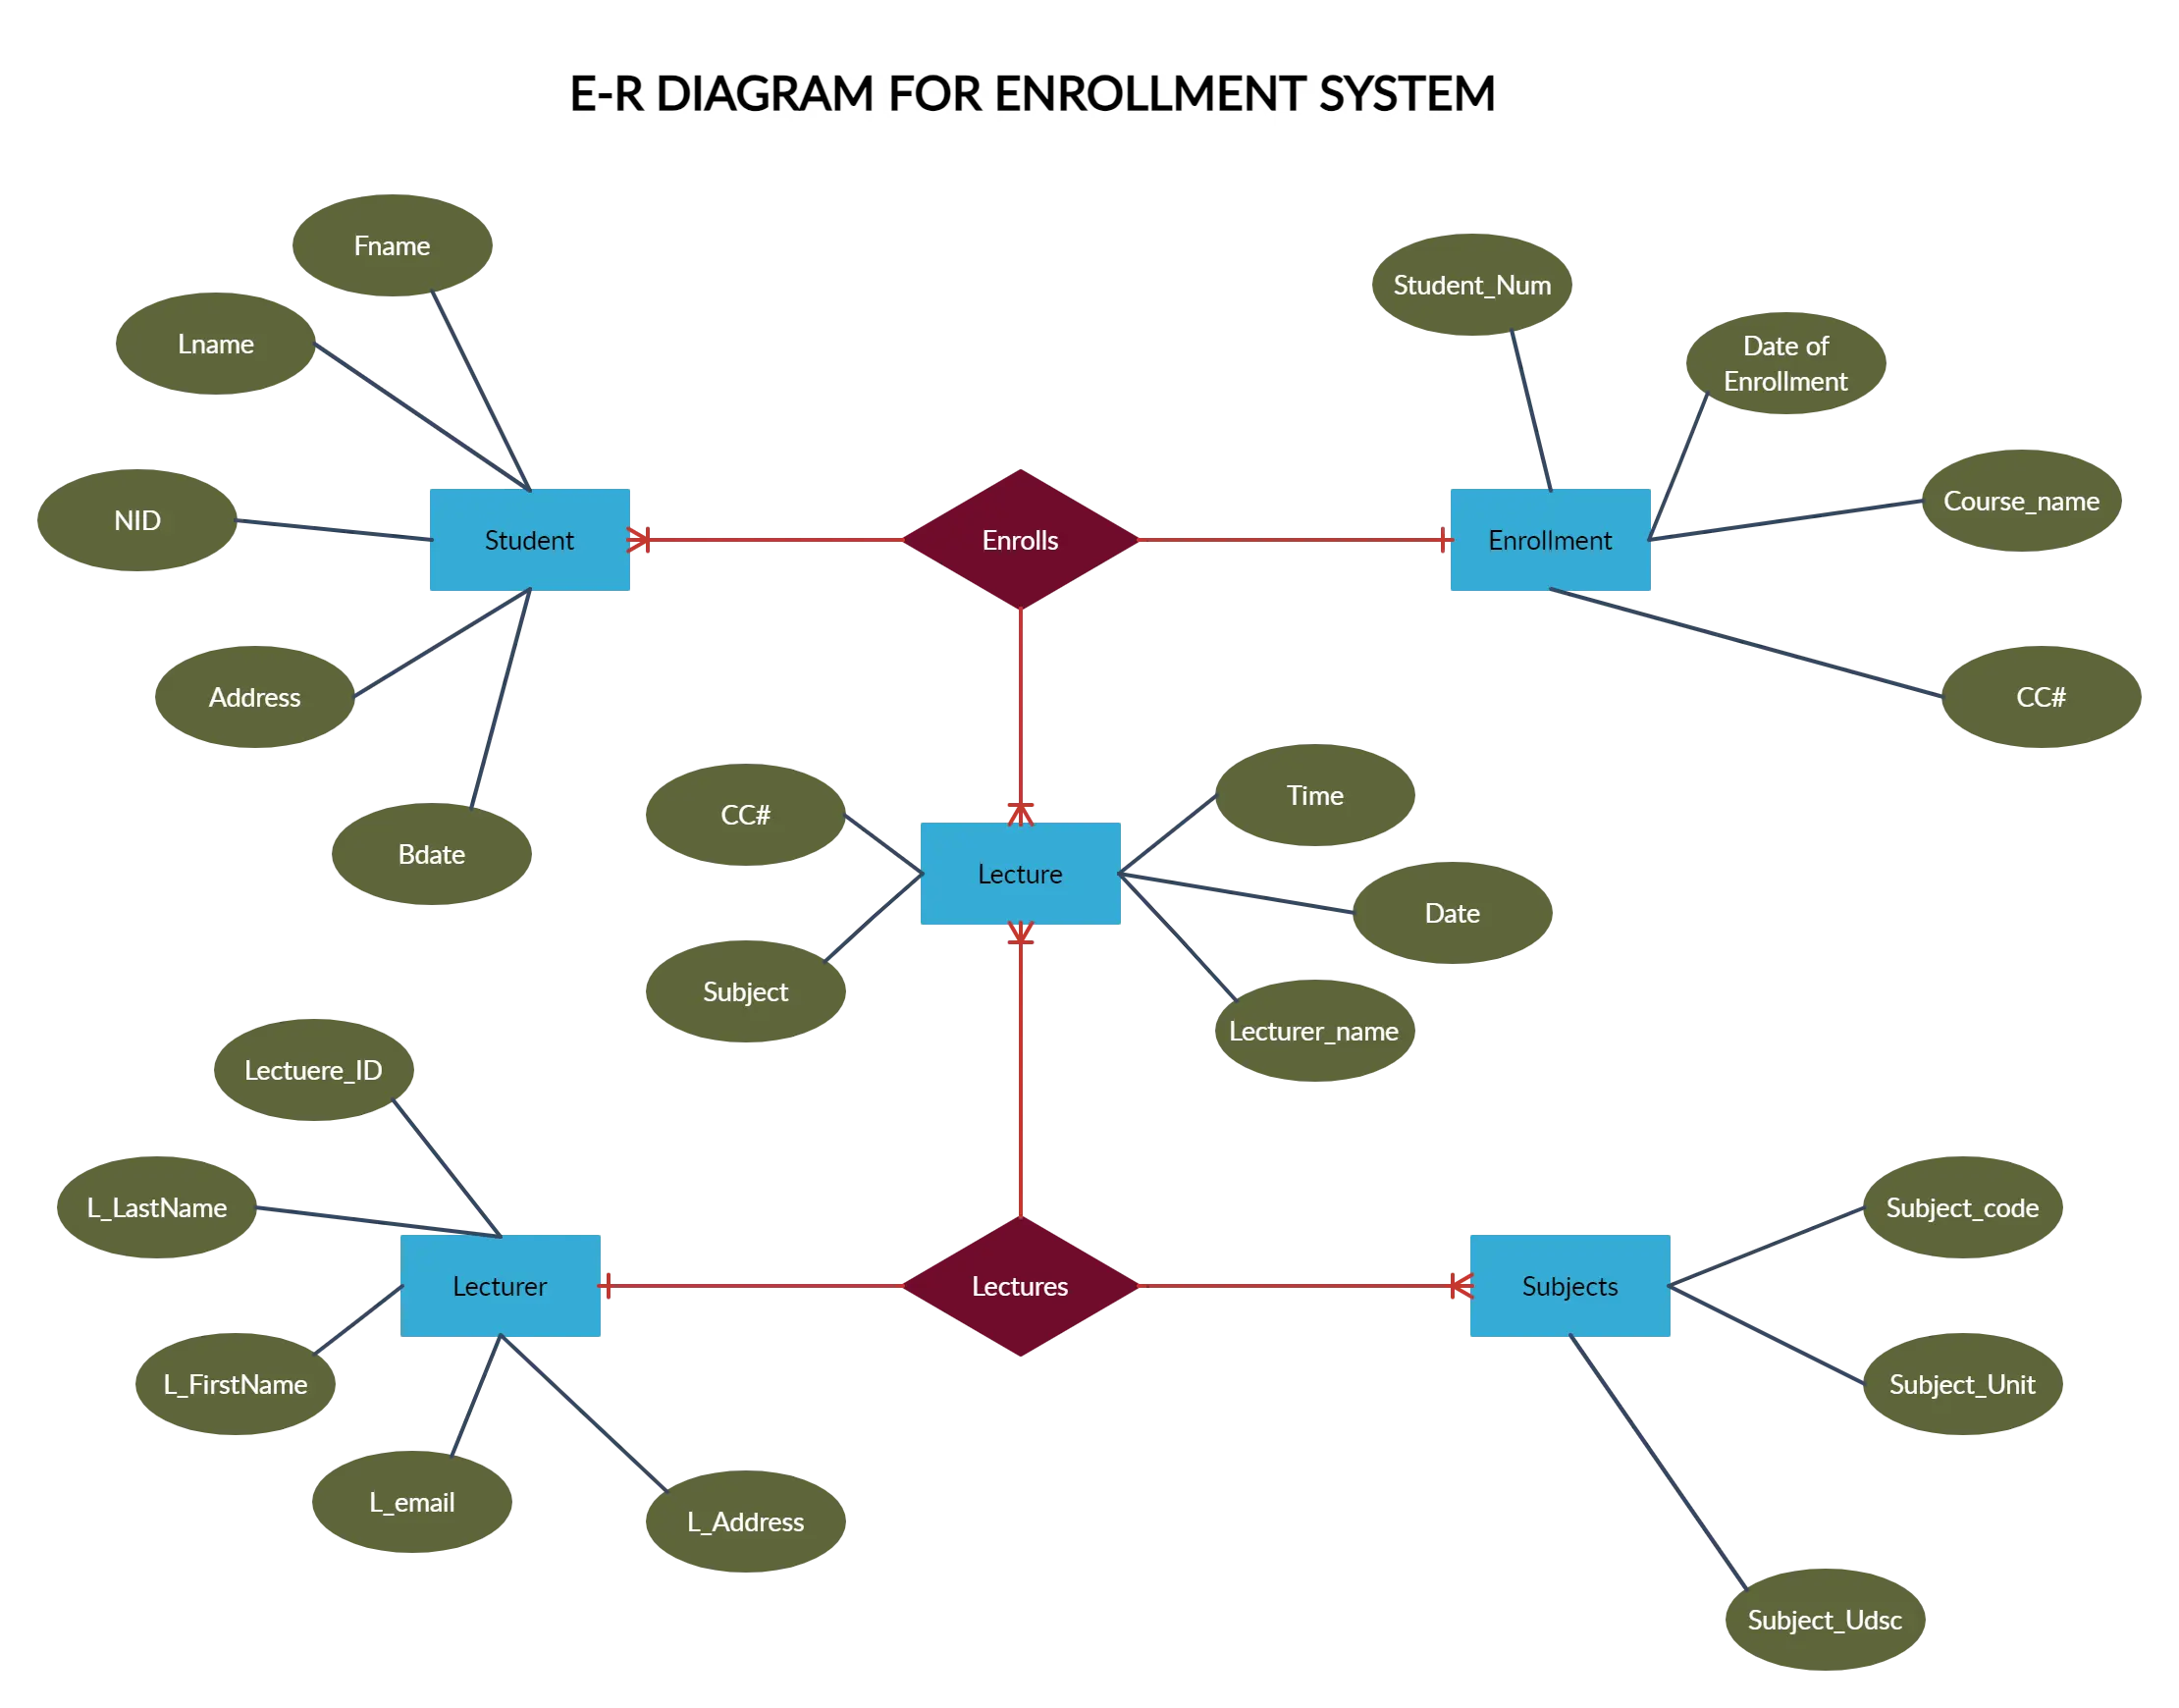 Edit this Template
- Ready to use
- Fully customizable template
- Get Started in seconds
Close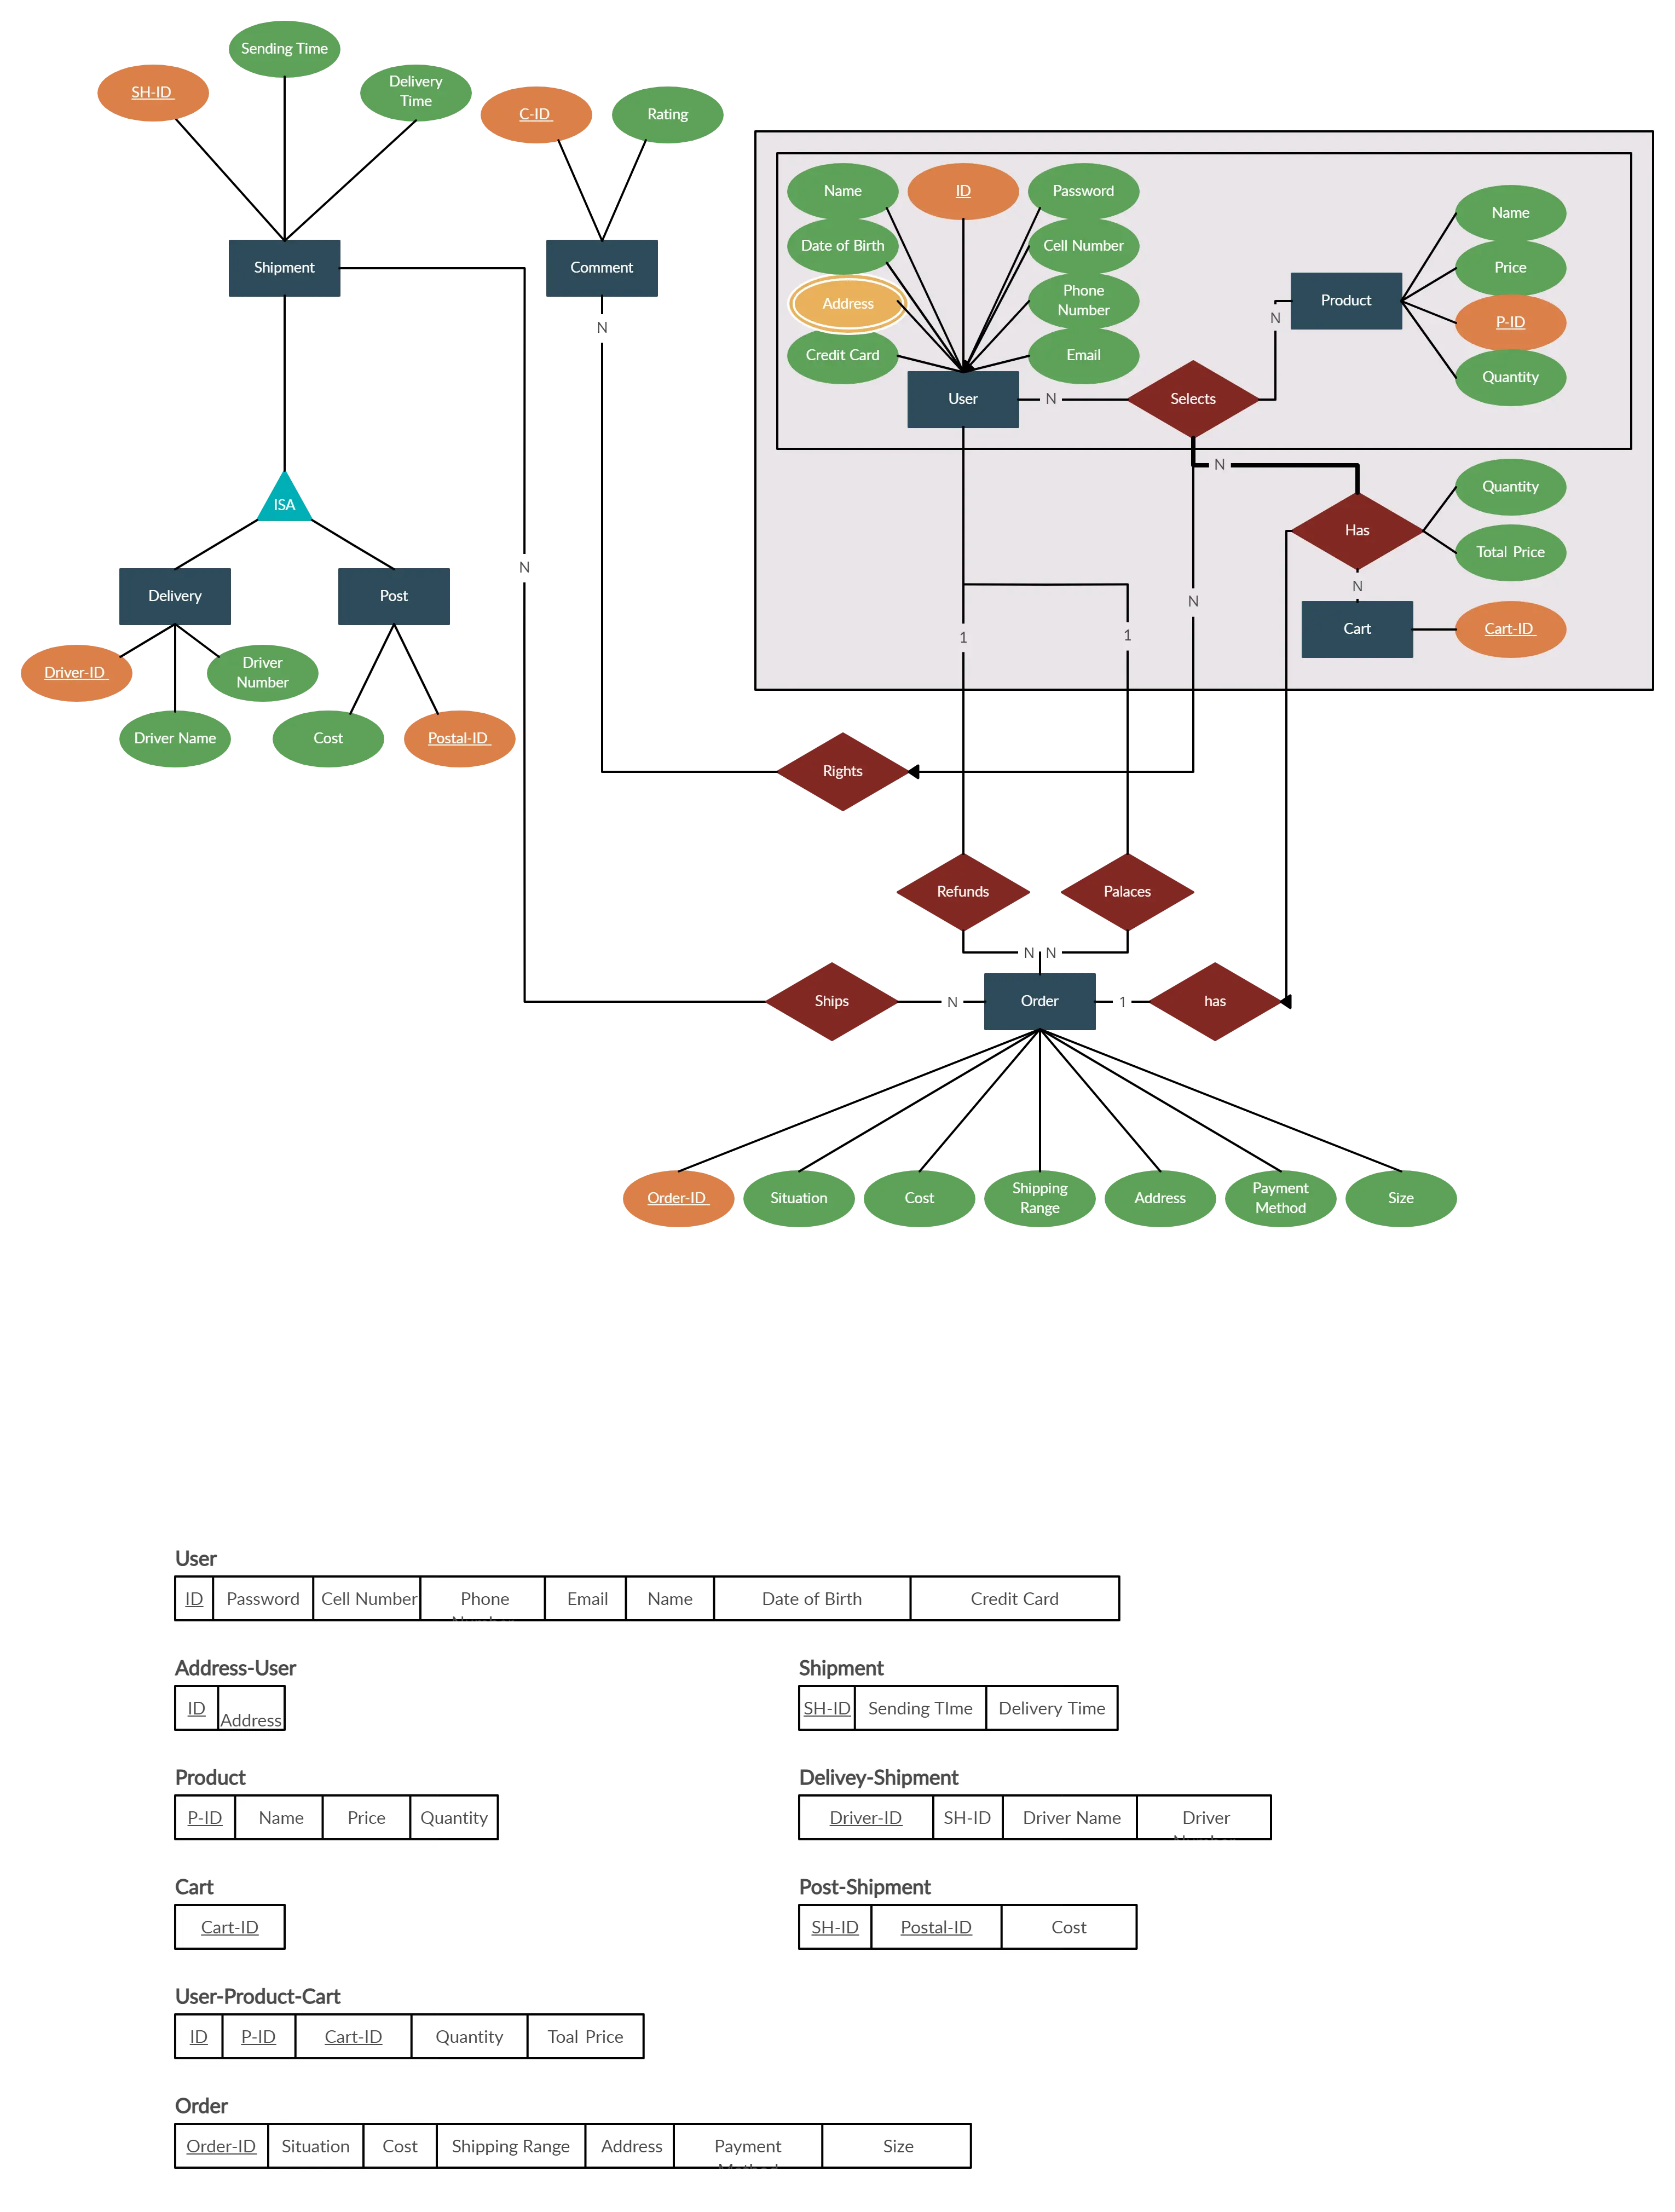 Edit this Template
- Ready to use
- Fully customizable template
- Get Started in seconds
Close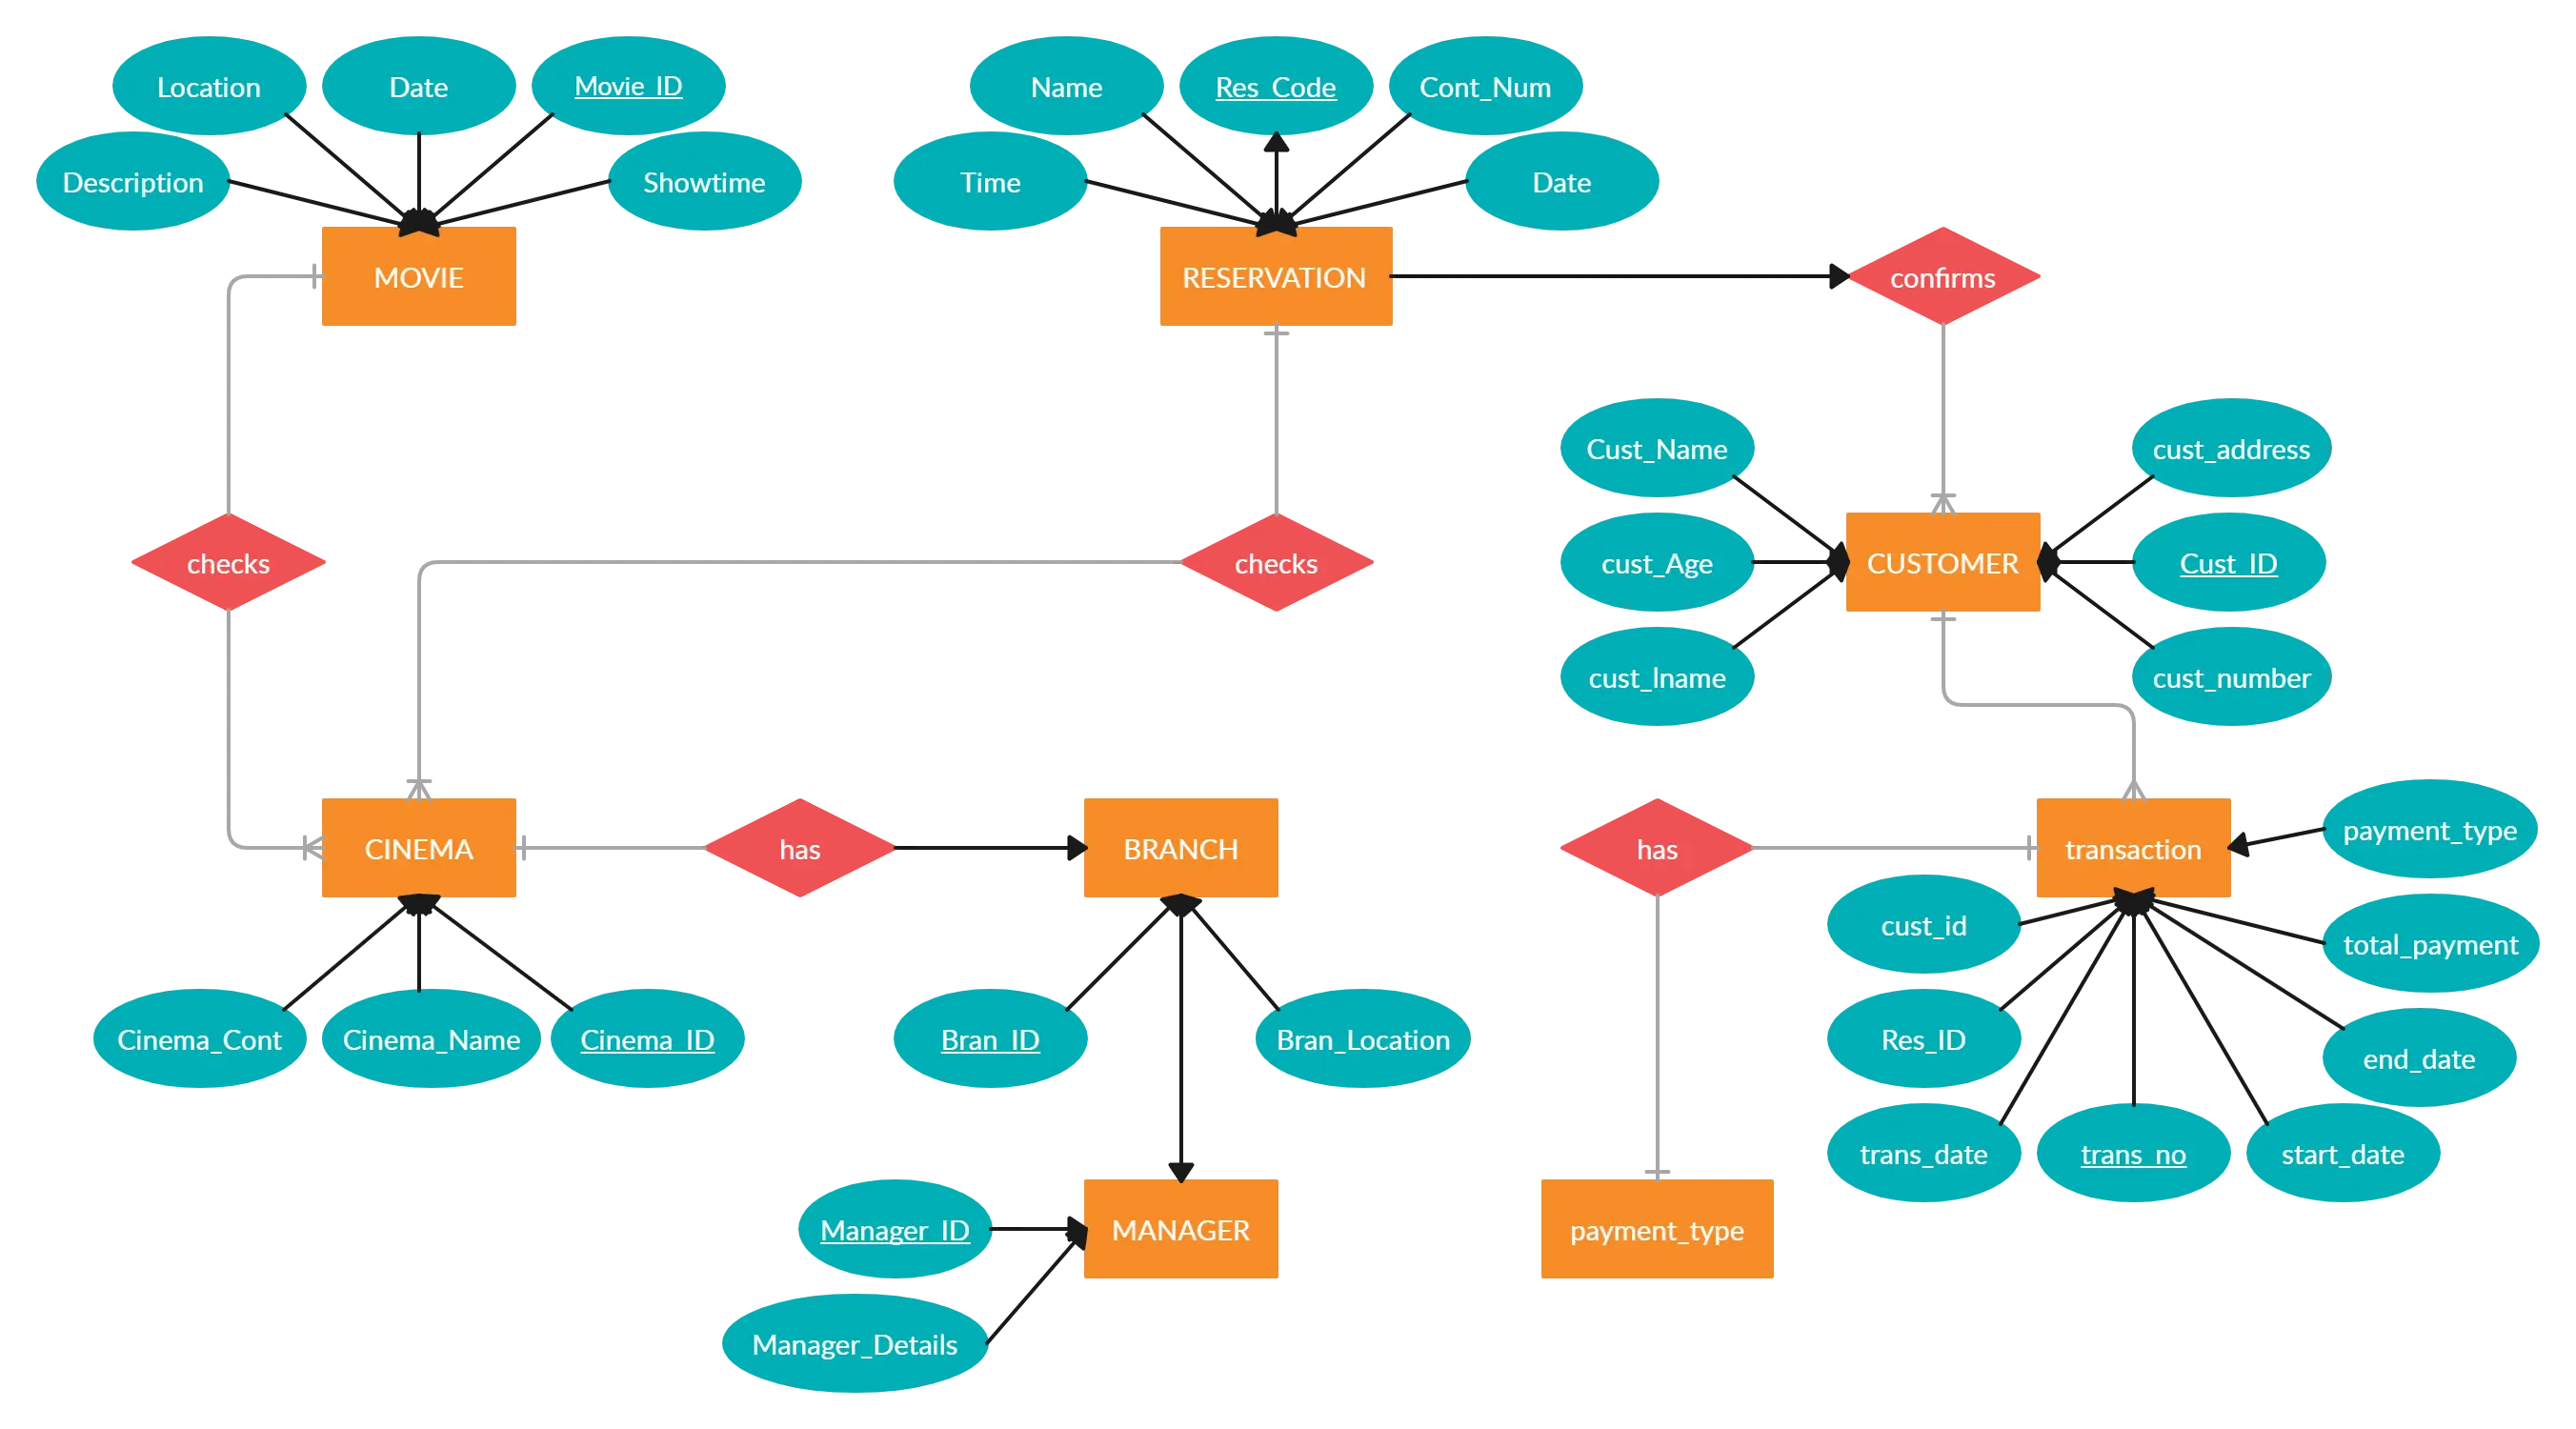 Edit this Template
- Ready to use
- Fully customizable template
- Get Started in seconds
Close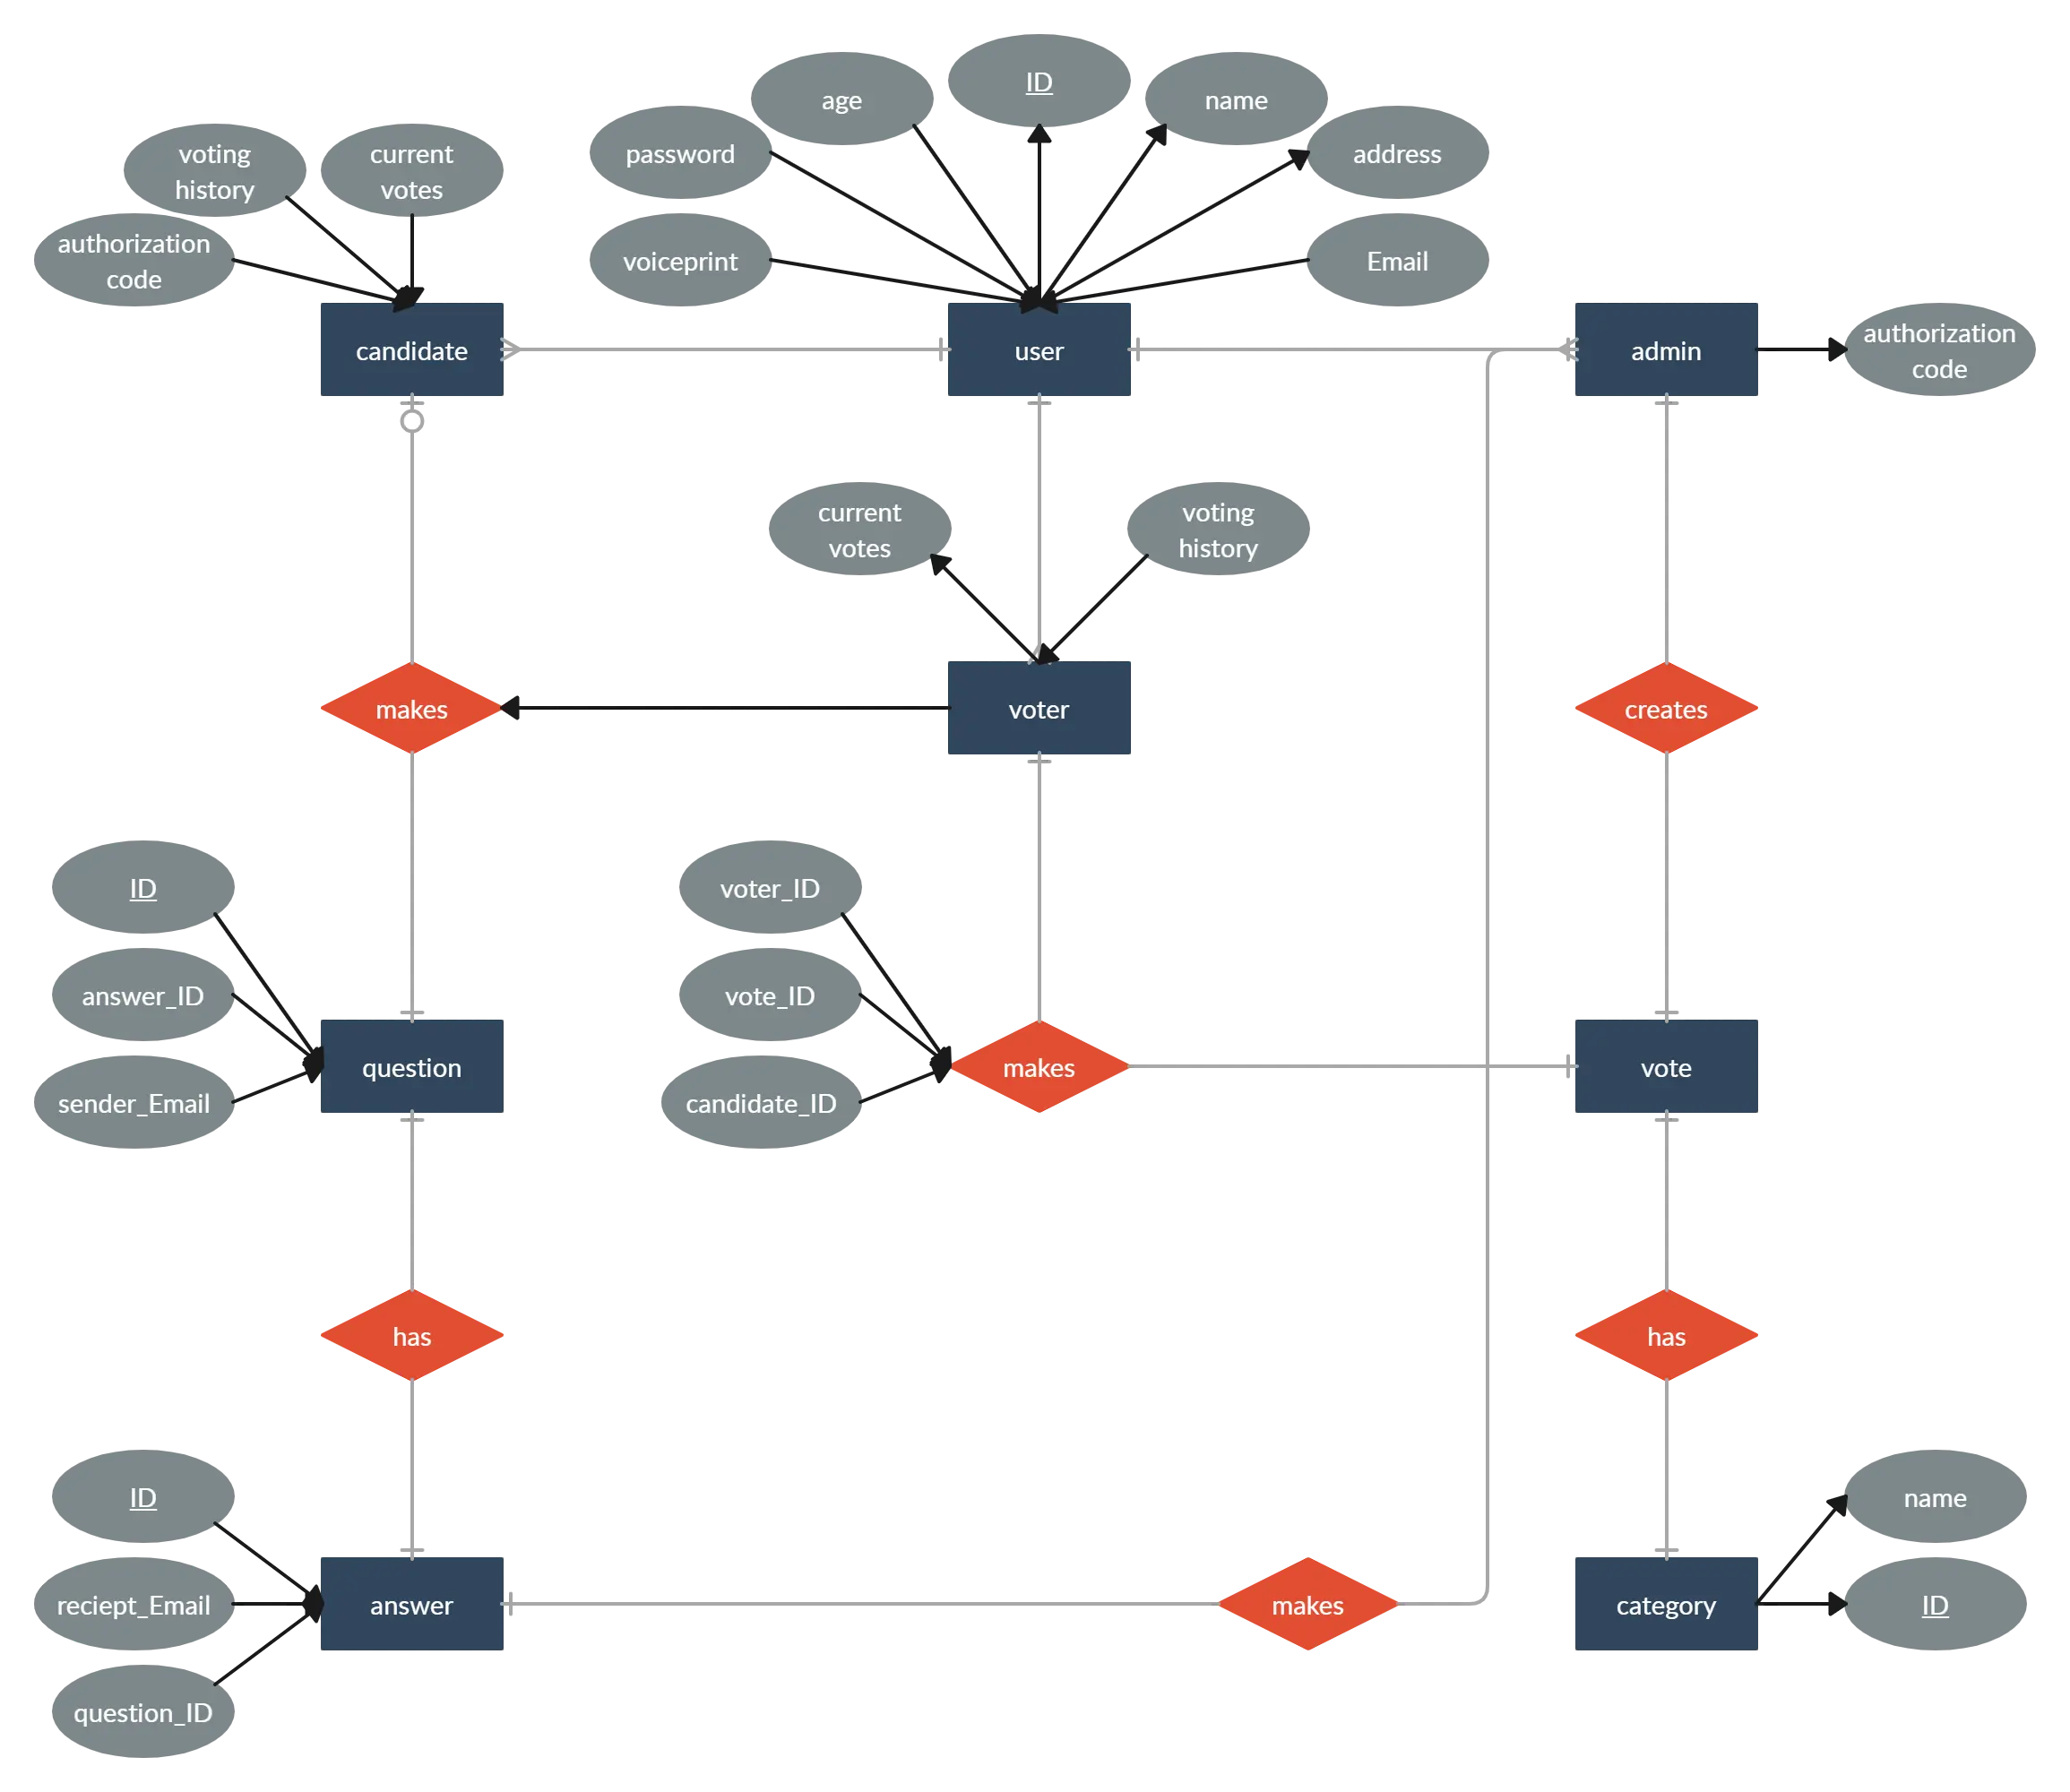 Edit this Template
- Ready to use
- Fully customizable template
- Get Started in seconds
Close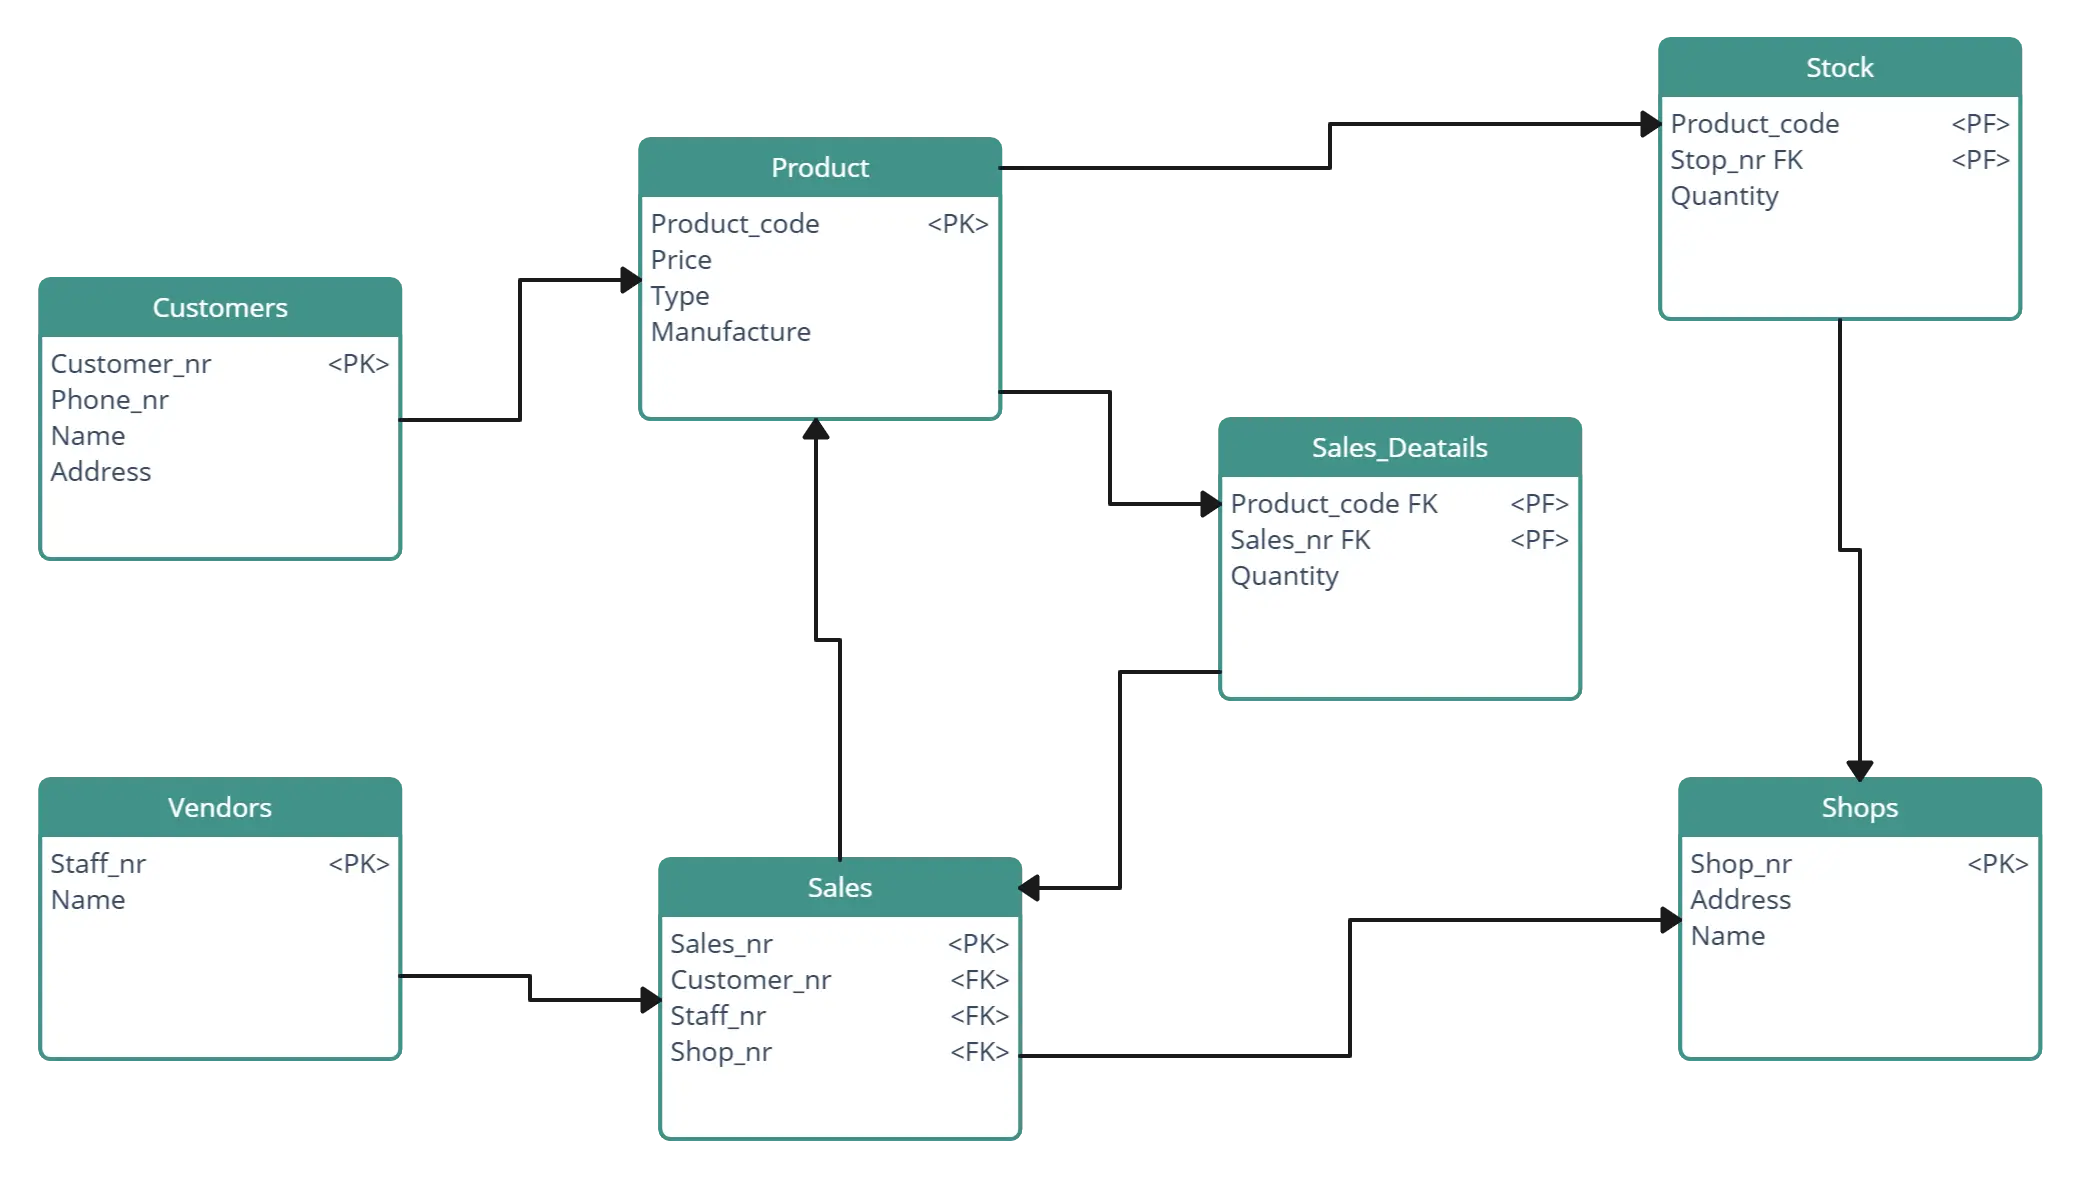 Edit this Template
- Ready to use
- Fully customizable template
- Get Started in seconds
Close Edit this Template
- Ready to use
- Fully customizable template
- Get Started in seconds
CloseUses of ER Diagrams?
ER diagrams are essential tools for designing, communicating, maintaining, and optimizing databases. They facilitate collaboration, ensure data integrity, and contribute to the efficient management of database systems. Here are several uses of ER diagrams.
Database design: ER diagrams are used to design databases. They provide a visual representation of how different pieces of information, called entities, are related to each other. This helps in planning the structure of the database before it’s built.
Communication: ER diagrams act as a common language between people involved in developing databases, such as developers, designers, and clients. They help everyone understand how the database will work and how data will be organized.
Database maintenance: Even after a database is created, ER diagrams remain useful for maintenance. They help developers understand the existing structure and make changes or updates as needed while ensuring the integrity of the database.
Documentation: ER diagrams serve as documentation for the database system. They provide a detailed overview of the database schema, including entities, attributes, and relationships. This documentation helps in troubleshooting issues and training new team members.
Identifying redundancy and inconsistencies: By visualizing relationships between entities, ER diagrams help identify redundant or inconsistent data in the database design. This allows for optimization and ensures data accuracy.
Database optimization: ER diagrams aid in optimizing database performance. By understanding entity relationships, developers can design efficient queries and data retrieval strategies, leading to improved performance and scalability.
Integration with development tools: ER diagrams can be integrated into various development tools and database management systems. Many software tools provide features for creating, editing, and generating code from ER diagrams, streamlining the database development process.
The Components and Features of ER Diagrams
Entities
An entity represents a real-world object, concept, or thing about which data is stored in the database. It could be a person, place, thing, event, or concept.
Characteristics
Attributes: Entities have attributes that describe their properties or characteristics.
Instances: Each entity has instances or occurrences, representing individual occurrences of the entity in the real world.
Identity: Each instance of an entity is uniquely identifiable and can be distinguished from other instances.
Relationships: Entities can be related to other entities through relationships, forming connections within the database schema.
Types of entities
Strong entities: Also known as regular entities, these entities have attributes that uniquely identify each instance. They can exist independently of other entities.
Weak entities: Weak entities do not have a primary key attribute of their own and depend on a related strong entity (owner entity) for their existence. They are identified by their relationship with the owner entity.
Associative entities: Also called many-to-many entities, these entities are used to represent relationships between relationships. They arise in many-to-many relationships and typically contain attributes in addition to the foreign keys linking the associated entities.
Types of entity keys
Simple key: A single attribute serves as the primary key.
Composite key: A combination of two or more attributes serves as the primary key. It is used when no single attribute uniquely identifies each instance.
Surrogate key: An artificially generated identifier, such as an auto-incremented integer, is used as the primary key. It is often added when no suitable natural key exists or when there are concerns about stability or size of natural keys.
Attributes
Attributes are the characteristics or properties of entities. They describe the details of each entity. For example, attributes of a “Customer” entity might include “Customer ID,” “Name,” and “Email Address.”
Characteristics
Name: Each attribute has a name that identifies it within the entity.
Data type: Attributes have a data type that specifies the kind of data they can hold, such as text, number, date, etc.
Constraints: Attributes may have constraints that define rules or conditions for the values they can contain, such as uniqueness or requiredness.
Domain: Attributes have a domain, which is the set of all possible values that the attribute can take.
Nullability: Attributes may allow null values, meaning they can have no value assigned to them for some instances of the entity.
Types of attributes
Simple attribute: A single atomic value is stored in the attribute. Example: Name, Age.
Composite attribute: An attribute that can be divided into smaller sub-parts, each representing a distinct attribute.
Example: Address (composed of Street, City, Zip Code).
Single-valued attribute: An attribute that holds a single value for each instance of the entity.
Multi-valued attribute: An attribute that can hold multiple values for each instance of the entity.
Example: Phone Numbers.
Relationships
Relationships show how entities are connected or related to each other in the database. They represent interactions or associations between entities. Examples include “owns,” “buys,” or “works for.”
Characteristics
Name: Each relationship has a name that describes the nature of the association between entities.
Directionality: Relationships can be unidirectional or bidirectional, indicating the flow or direction of the association between entities.
Cardinality: Cardinality specifies the number of instances of one entity that can be associated with instances of another entity in a relationship. It defines the minimum and maximum occurrences of related entities.
Degree: The degree of a relationship indicates the number of entities participating in the relationship. Relationships can be unary (involving a single entity), binary (involving two entities), ternary (involving three entities), etc.
Attributes: Relationships can have attributes that describe additional information or properties about the association between entities.
Recursive relationships: Some relationships involve an entity being related to itself, known as recursive relationships. They represent connections or interactions within the same entity.
Types of relationships
One-to-one (1:1): Each instance of one entity is associated with exactly one instance of another entity.
One-to-many (1:N): Each instance of one entity is associated with multiple instances of another entity, but each instance of the other entity is associated with only one instance of the first entity.
Many-to-one (N:1): Multiple instances of one entity are associated with exactly one instance of another entity.
Many-to-many (M:N): Multiple instances of one entity are associated with multiple instances of another entity, and vice versa.
Recursive relationships: An entity is related to itself through a relationship. This can represent hierarchical structures or self-referential associations.
Cardinality
Cardinality specifies the number of instances of one entity that can be associated with the number of instances of another entity in a relationship. It describes the minimum and maximum number of occurrences of one entity that can be associated with occurrences of another entity.
Minimum cardinality: Specifies the minimum number of instances required in a relationship.
Maximum cardinality: Indicates the maximum number of instances allowed in a relationship.
Directionality: Determines if the relationship is one-way or two-way.
Completeness: Shows whether participation in the relationship is mandatory or optional.
Multiplicity: Defines the range of valid occurrences for each entity.
Constraint enforcement: Ensures data integrity by enforcing rules on entity participation.
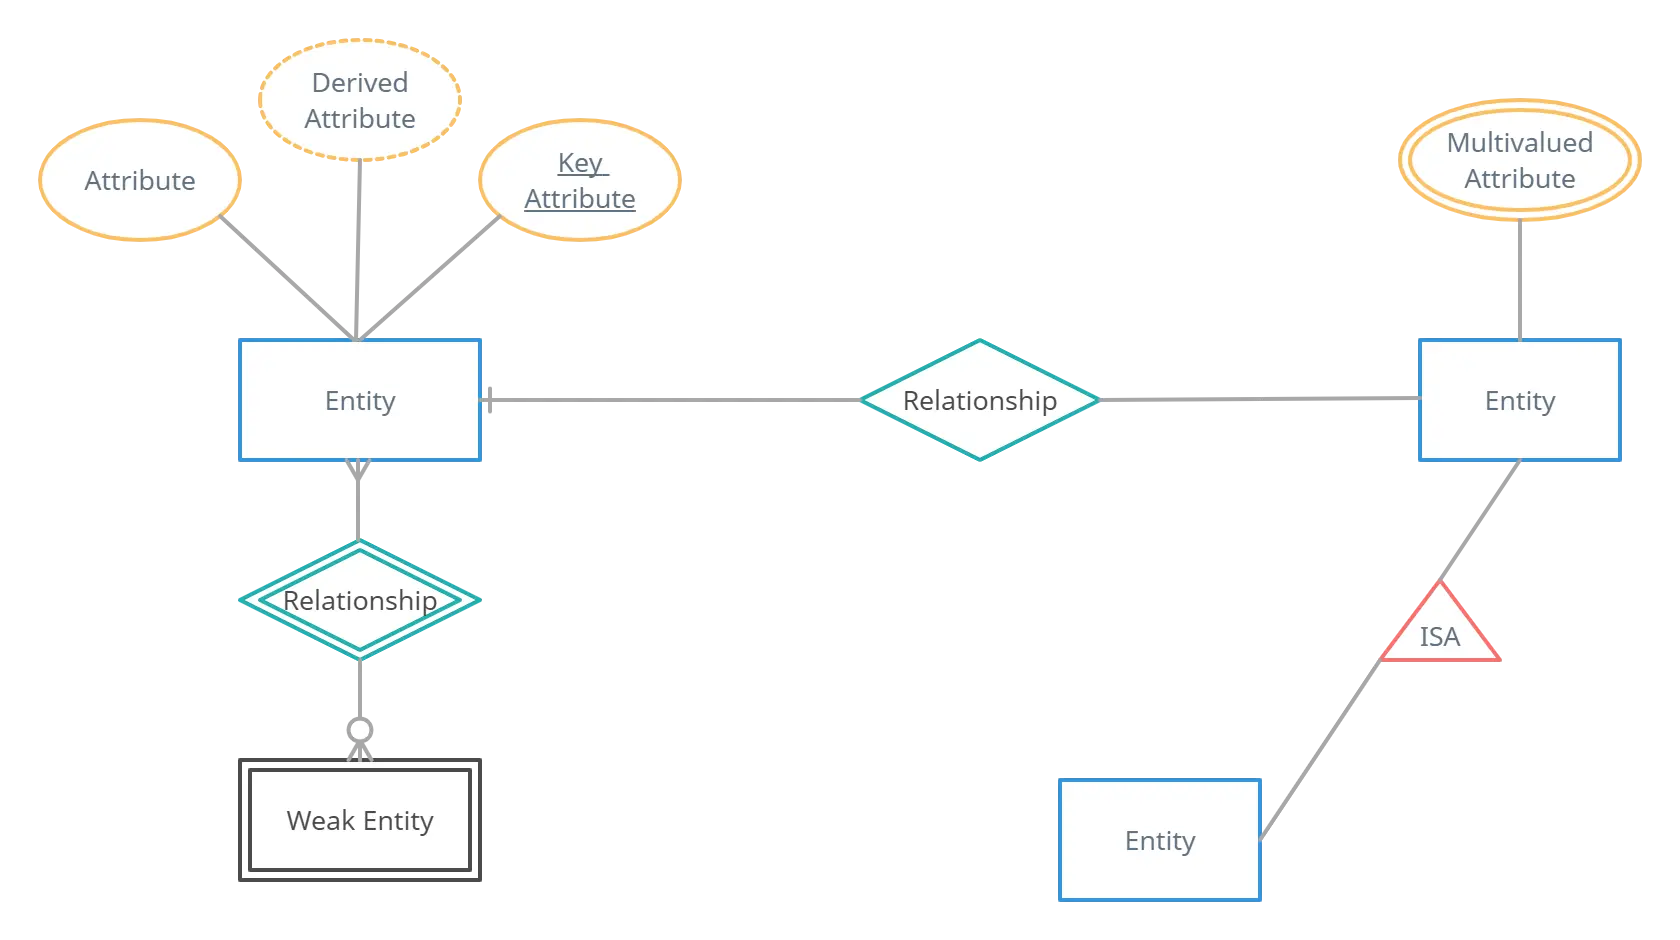
Entity Relationship Diagram (ERD) Symbols and Notations
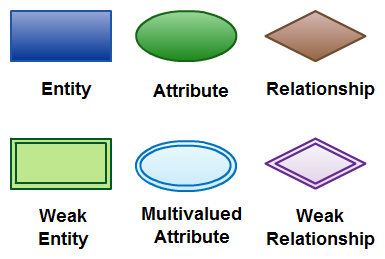
There are three basic elements in an ER Diagram: entity, attribute, relationship. There are more elements which are based on the main elements. They are weak entity, multi valued attribute, derived attribute, weak relationship, and recursive relationship. Cardinality and ordinality are two other notations used in ER diagrams to further define relationships.
Entity
An entity can be a person, place, event, or object that is relevant to a given system. For example, a school system may include students, teachers, major courses, subjects, fees, and other items. Entities are represented in ER diagrams by a rectangle and named using singular nouns.
Weak Entity
A weak entity is an entity that depends on the existence of another entity. In more technical terms it can be defined as an entity that cannot be identified by its own attributes. It uses a foreign key combined with its attributed to form the primary key. An entity like order item is a good example for this. The order item will be meaningless without an order so it depends on the existence of the order.

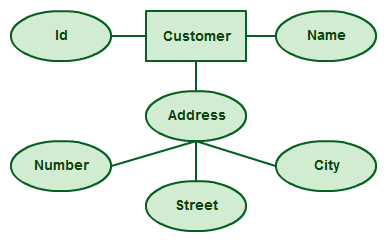
Attribute
An attribute is a property, trait, or characteristic of an entity, relationship, or another attribute. For example, the attribute Inventory Item Name is an attribute of the entity Inventory Item. An entity can have as many attributes as necessary. Meanwhile, attributes can also have their own specific attributes. For example, the attribute “customer address” can have the attributes number, street, city, and state. These are called composite attributes. Note that some top level ER diagrams do not show attributes for the sake of simplicity. In those that do, however, attributes are represented by oval shapes.
Multivalued Attribute
If an attribute can have more than one value it is called a multi valued attribute. It is important to note that this is different from an attribute having its own attributes. For example, a teacher entity can have multiple subject values.

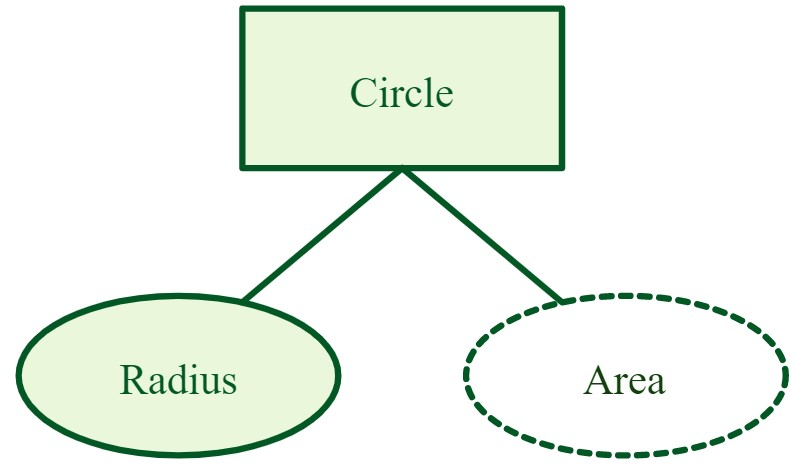
Derived Attribute
An attribute based on another attribute. This is found rarely in ER diagrams. For example, for a circle, the area can be derived from the radius.
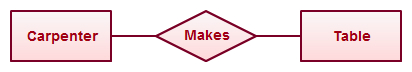
Relationship
A relationship describes how entities interact. For example, the entity “Carpenter” may be related to the entity “table” by the relationship “builds” or “makes”. Relationships are represented by diamond shapes and are labeled using verbs.
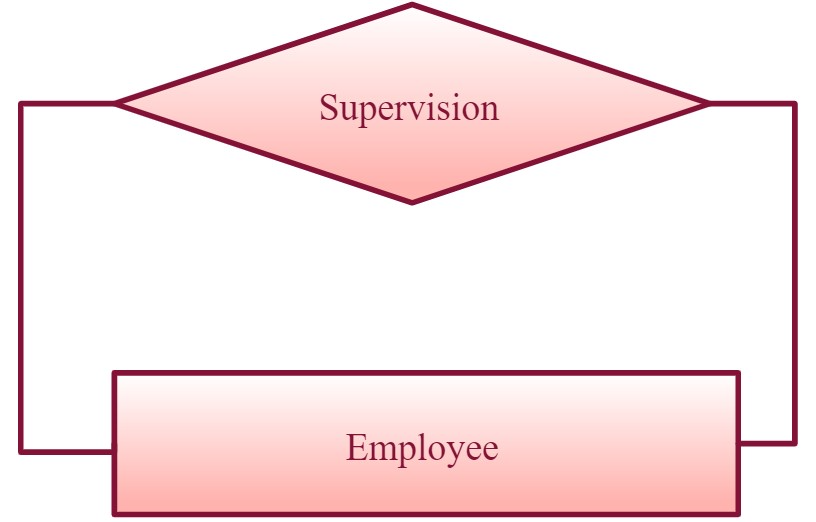
Recursive Relationship
If the same entity participates more than once in a relationship it is known as a recursive relationship. In the below example an employee can be a supervisor and be supervised, so there is a recursive relationship.
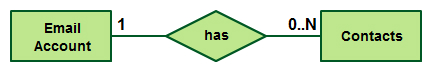
Cardinality and Ordinality
These two further defines relationships between entities by placing the relationship in the context of numbers. In an email system, for example, one account can have multiple contacts. The relationship, in this case, follows a “one to many” model. There are a number of notations used to present cardinality in ER diagrams. Chen, UML, Crow’s foot, Bachman are some of the popular notations. Creately supports Chen, UML and Crow’s foot notations.The following example uses UML to show cardinality.
How to Draw ER Diagrams
Below points show how to go about creating an ER diagram.
- Identify all the entities in the system. An entity should appear only once in a particular diagram. Create rectangles for all entities and name them properly.
- Identify relationships between entities. Connect them using a line and add a diamond in the middle describing the relationship.
- Add attributes for entities. Give meaningful attribute names so they can be understood easily.
Sounds simple right? In a complex system, it can be a nightmare to identify relationships. This is something you’ll perfect only with practice.
Conceptual, Logical and Physical Data Models
Conceptual, logical, and physical data models are three distinct stages in the process of designing and implementing a database system. Each model serves a specific purpose and targets different levels of abstraction.
Conceptual Data Model
Purpose: The conceptual data model represents the highest level of abstraction and focuses on understanding the business requirements and concepts without considering implementation details. Characteristics: Describes entities, their attributes, and the relationships between them at a conceptual level. Independent of any specific database management system (DBMS) or technology. Provides a global view of the entire database system without delving into technical details. Representation: Often depicted using Entity-Relationship (ER) diagrams or similar graphical tools. Example: In a university system, the conceptual data model might include entities like Student, Course, and Instructor, along with their attributes and relationships.
Logical Data Model
Purpose: The logical data model translates the conceptual model into a more detailed and structured representation that can be implemented in a specific DBMS. Characteristics: Defines the structure of the database using tables, columns, keys, and relationships. Captures data requirements and relationships more precisely than the conceptual model. Still independent of the physical implementation details such as storage optimizations or indexing strategies. Representation: Often depicted using Entity-Relationship (ER) diagrams or Unified Modeling Language (UML) class diagrams, along with normalization techniques. Example: In the university system, the logical data model would specify tables like Student, Course, and Instructor, along with their attributes and primary/foreign keys.
Physical Data Model
Purpose: The physical data model represents the actual implementation of the database design in a specific DBMS, considering storage structures, indexing strategies, and optimization techniques. Characteristics: Translates the logical data model into a schema that can be directly implemented in a DBMS. Specifies details such as data types, indexes, partitions, and storage allocation. Optimized for performance, scalability, and efficiency based on the requirements of the application and the capabilities of the chosen DBMS. Representation: Often represented using Data Definition Language (DDL) scripts or database schema diagrams specific to the chosen DBMS. Example: In the university system, the physical data model would include details like table definitions with specific data types, indexes on frequently queried columns, and partitioning strategies for large tables.
Limitations of ER Diagrams
While Entity-Relationship diagrams are widely used for database design and modeling, they do have some limitations:
ER diagrams can get really complicated, especially in big systems with lots of entities and relationships. It can be tough to manage and understand these complicated diagrams, making it harder to see how the database works overall.
Sometimes ER diagrams don’t capture everything about the real world accurately. This can happen if the descriptions used to make the diagrams aren’t clear or if there are differences in how people understand things. It can lead to mistakes or confusion in the diagram.
ER diagrams focus on the big picture of the database structure, but they might miss out on some of the smaller details, like how the data is actually stored or used. This means they might not show everything about how the database works.
ER diagrams have trouble showing certain kinds of relationships or rules well. For example, really complicated structures or rules about time or space can be hard to draw accurately using ER diagrams.
ER diagrams might not be great at showing certain ideas from object-oriented programming, like inheritance or polymorphism. It can be tricky to translate these ideas into ER diagrams, and it might need extra explanations or changes to make them work.
As databases change over time, ER diagrams might need to be updated to show the changes accurately. Keeping track of these changes and making sure the diagrams match the actual database can take a lot of time and effort.
ER Diagram Best Practices
Provide a precise and appropriate name for each entity, attribute, and relationship in the diagram. Terms that are simple and familiar always beats vague, technical-sounding words. In naming entities, remember to use singular nouns. However, adjectives may be used to distinguish entities belonging to the same class (part-time employee and full-time employee, for example). Meanwhile attribute names must be meaningful, unique, system-independent, and easily understandable.
Remove vague, redundant or unnecessary relationships between entities.
Never connect a relationship to another relationship.
Make effective use of colors. You can use colors to classify similar entities or to highlight key areas in your diagrams.
Benefits of ER diagrams
ER diagrams constitute a very useful framework for creating and manipulating databases. First, ER diagrams are easy to understand and do not require a person to undergo extensive training to be able to work with it efficiently and accurately. This means that designers can use ER diagrams to easily communicate with developers, customers, and end users, regardless of their IT proficiency.
Second, ER diagrams are readily translatable into relational tables which can be used to quickly build databases. In addition, ER diagrams can directly be used by database developers as the blueprint for implementing data in specific software applications.
Lastly, ER diagrams may be applied in other contexts such as describing the different relationships and operations within an organization.
Drawing ER Diagrams Using Creately
You can draw entity relationship diagrams manually, especially when you are just informally showing simple systems to your peers. However, for more complex systems and for external audiences, you need diagramming software such as Creately to craft visually engaging and precise ER diagrams. The ER diagram software offered by Creately as an online service is pretty easy to use and is a lot more affordable than purchasing licensed software. It is also perfectly suited for development teams because of its strong support for collaboration.
FAQs about Entity Relationship Diagrams
- Not defining the entities and relationships clearly
- Overcomplicating the diagram by including too many entities and relationships
- Using inconsistent naming conventions for entities and attributes
- Failing to specify cardinality and participation constraints for relationships
- Using unclear or ambiguous symbols or terminology
ER diagrams can represent several types of relationships, such as:
- one-to-one,
- one-to-many, and
- many-to-many relationships.