Ever heard of people going on and on about Graphic Organizers? Ever wondered the importance of them?
As the name implies, graphic organizers are visual learning tools that facilitate the students’ ability to learn and understand better. However, the effectiveness of these graphic organizers depends on the involvement of the teachers and their responsibilities in explaining to students how to use such tools.
Why Do You Need to Use Graphic Organizers?
Graphic organizers are suitable for students in all age groups; it helps them organize complex information into concise visual maps. Is that all? No, they have a great potential for fostering learning in a variety of different areas in education, particularly comprehension, reading, and vocabulary skills.
We, at Creately, studied the importance of these graphic organizers and designed a number of easy-to-use graphic organizer templates.
After doing extensive research on the popularity of specific graphic organizers, we designed templates for Storyboards, Fishbone Diagrams, T Charts, Y Charts, Cycle Diagrams, Venn Diagrams, ISP (Information, Source, Page) Charts, Persuasion Maps, KWL (Know- Wonder- Learn) Charts, and much more.
You can see a few of our worked examples and template samples below.
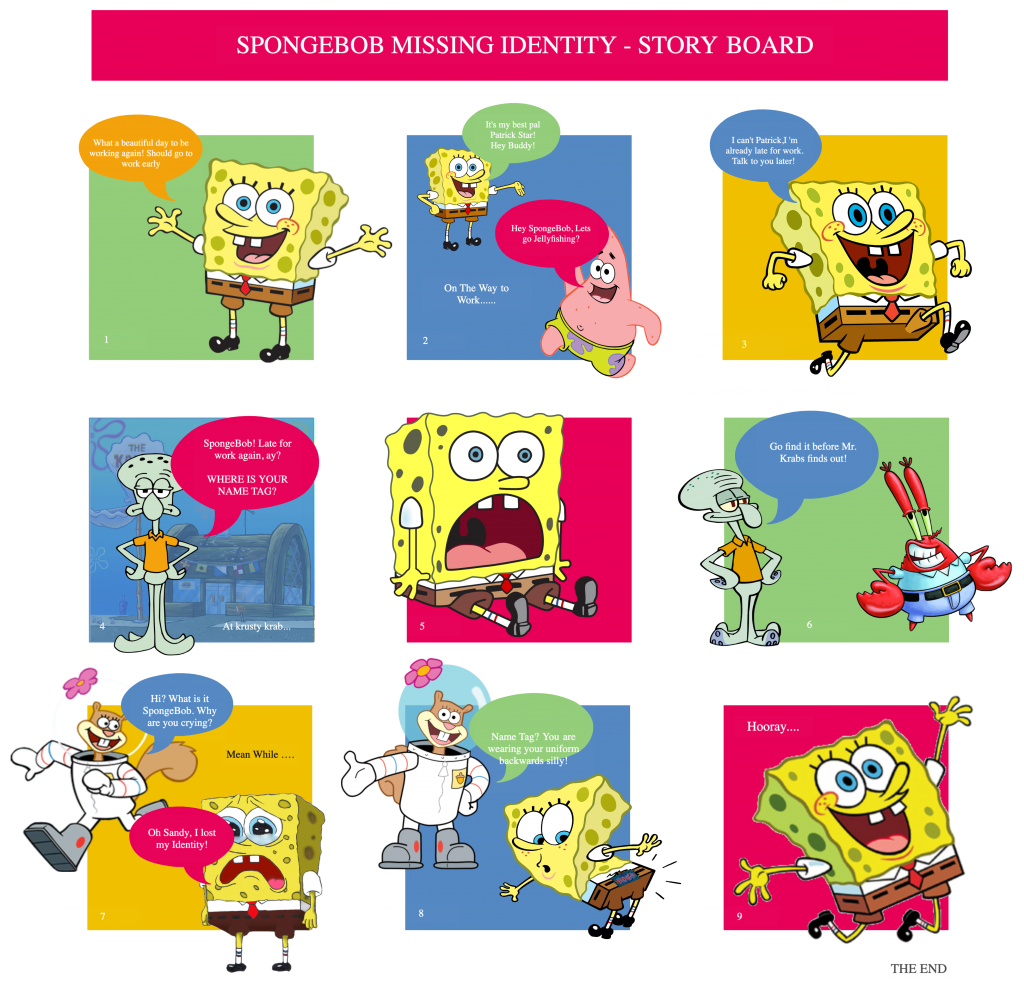
StoryBoards
Storyboarding is a great technique for discussing books and literature and one of the frequently used graphic organizer types. With Creately’s Storyboard Graphic Organizer Templates, you get a web-based visual organizer which helps students work together on writing to better understand the story. It’s great for discussing story structures and exploring the varied ways in which the author works with time.
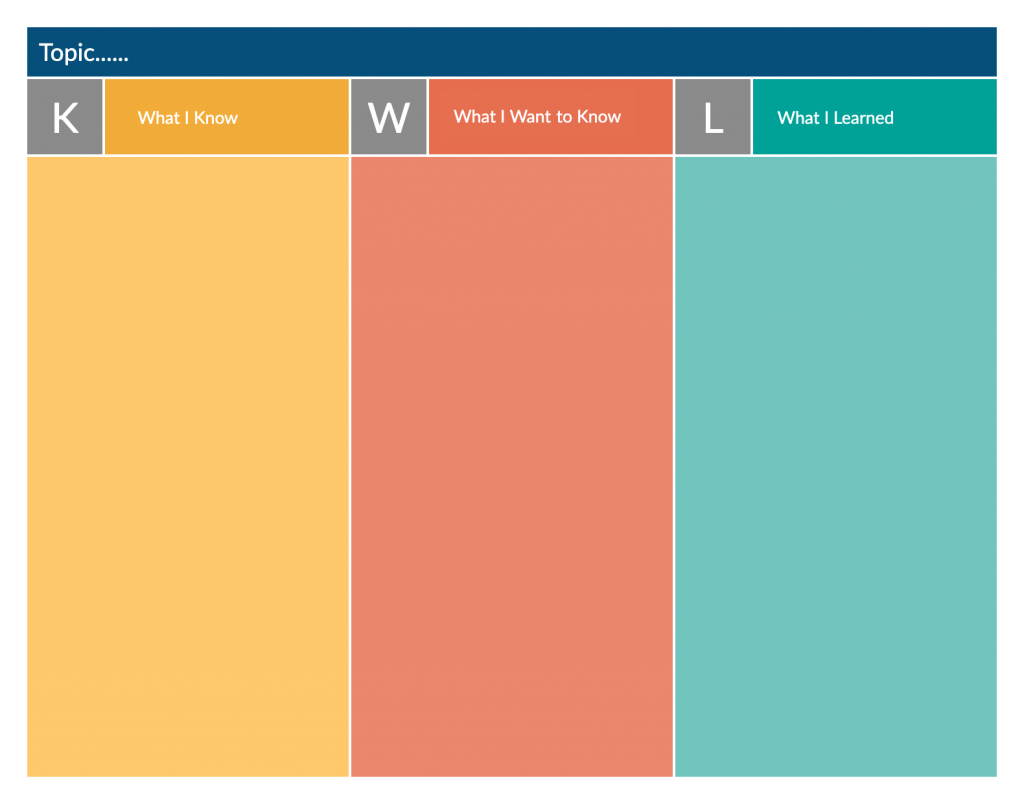
KWL Charts
A KWL Chart or ‘Know–Want to know–Learned‘ chart is an excellent visual graphic organizer. It encourages students to read and actively seek knowledge. It can also be used as a method to summarize the day’s lessons and emphasize things learned during the day. It helps teachers to be more interactive in their lessons. Creately is loaded with great KWL chart templates that you can put to use immediately in your classroom. Students can work online as a group on a KWL chart and share with you to submit their work as an assignment. You can download them if you want as well.
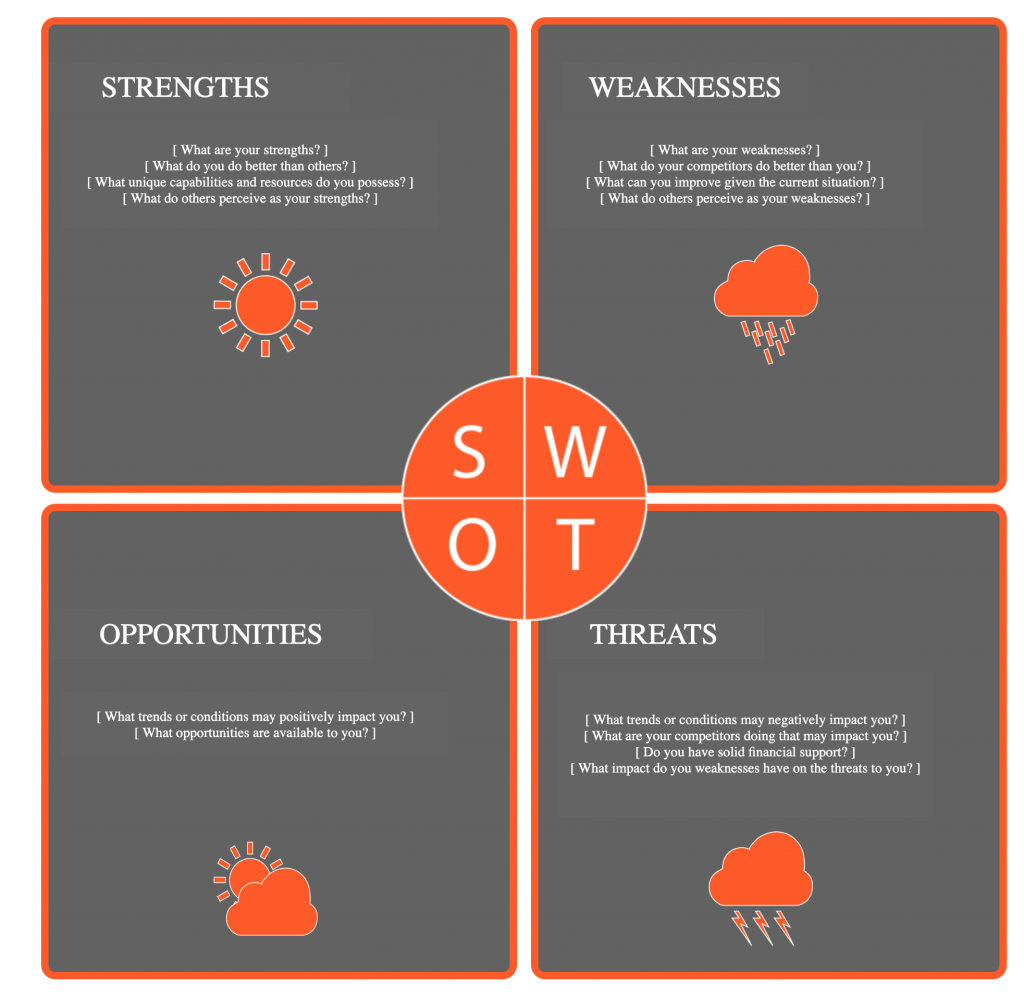
SWOT Analysis
SWOT Analysis is a method to evaluate the strengths, weaknesses, opportunities, and threats involved in a project. Although mostly used by business ventures to analyze themselves and competitors, they can be easily used in the classroom as well. They are a powerful graphic organizer because they give a quick overview of a project. You can now brainstorm using a SWOT analysis with your students using our online SWOT Analysis templates and organizers. From the classroom to the boardroom, a SWOT analysis is a powerful tool and Creately helps you get the best out of them.
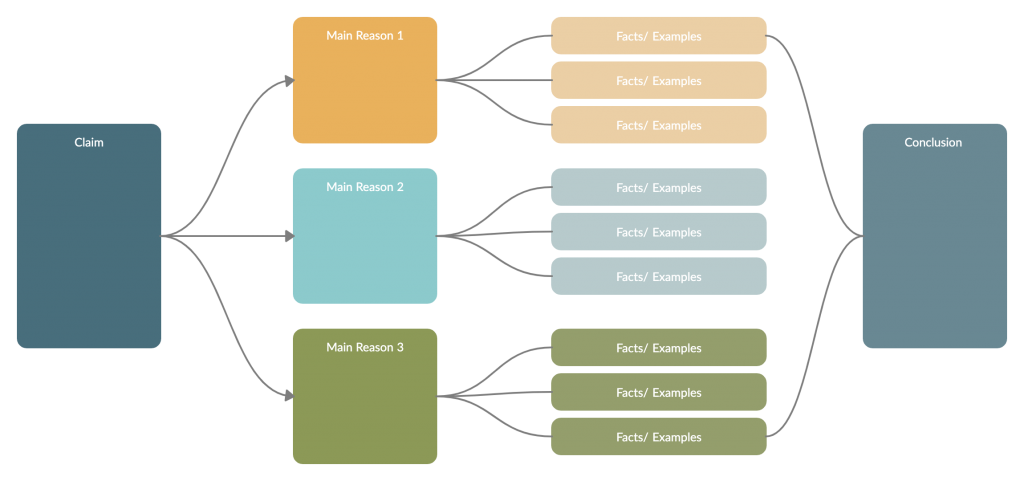
Persuasion Map
This is a very effective tool that helps students map out their arguments for a persuasive debate or essay. In Creately the Persuasion Map templates are completely customizable and accessible online anytime.
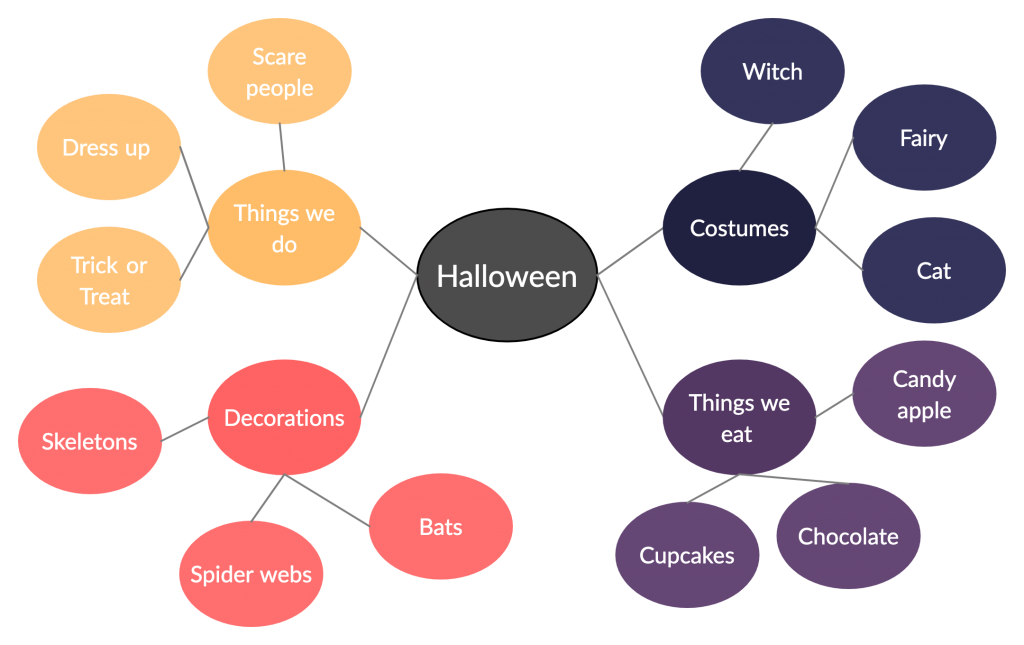
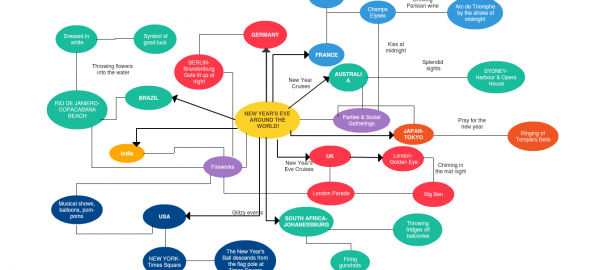
Cluster/ Word Web
In Cluster/ World Web templates, the students are expected to write the topic in discussion in the center circle and the details in the smaller circles. A great way to visualize a topic easily.
ISP Chart
ISP Chart is also known as the ‘Information- Sources- Page’ Chart. These chart templates in Creately would come in handy for students who are trying to compile a list of references for any project/ assignment/ thesis they are working on.

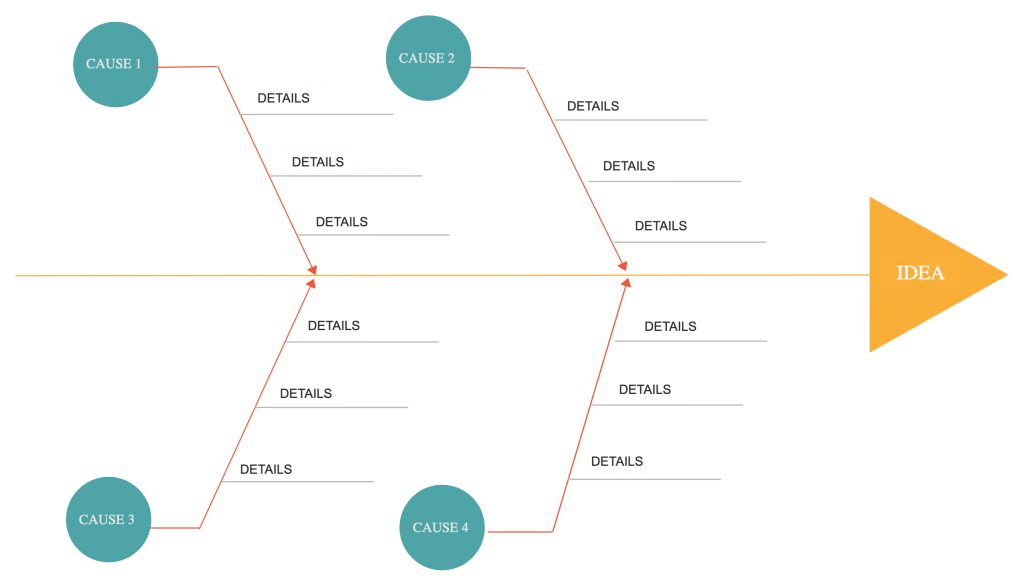
Fishbone Diagram
A Fishbone diagram is generally used to identify the cause and effect of any given situation. It helps explore many aspects or effects of a topic allowing students to easily organize their thoughts, make connections between elements, and gain a deeper understanding about what they are learning or analyzing.
T Chart
T Chart is used for listing out two different viewpoints on the same topic. For example The pros and cons of Online Education, the benefits and drawbacks of Social Media, and so on. It’s a handy visual tool to conduct topic comparing activities.

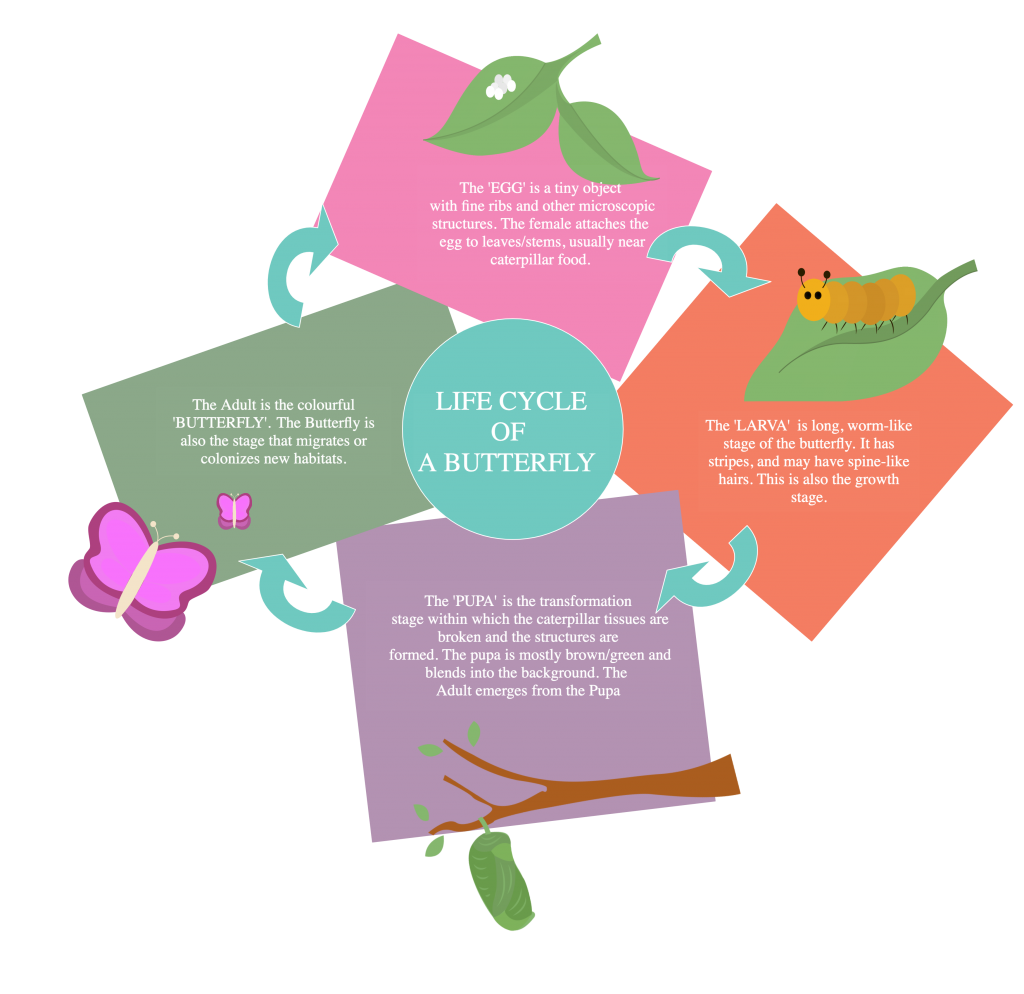
Cycle Diagram
Cycle Diagram is a type of graphic organizer that shows the circular relationships between items. Using a cycle diagram, students can easily identify the main events of the cycle, how they interact, and how the cycle repeats.
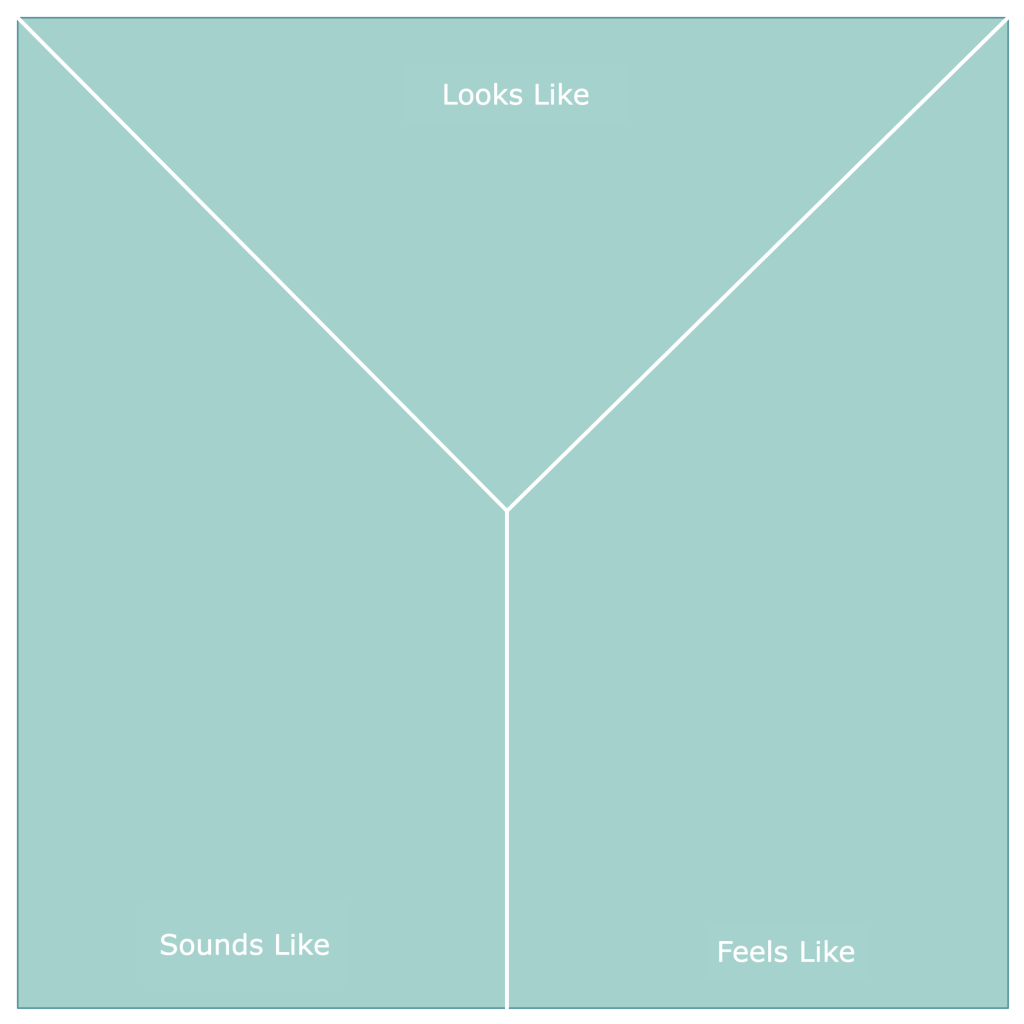
Y Chart
Y Chart is a tool that helps students organize their ideas around three dimensions. They can either write or choose to draw what the subject in question looks like, feels like, and sounds like.
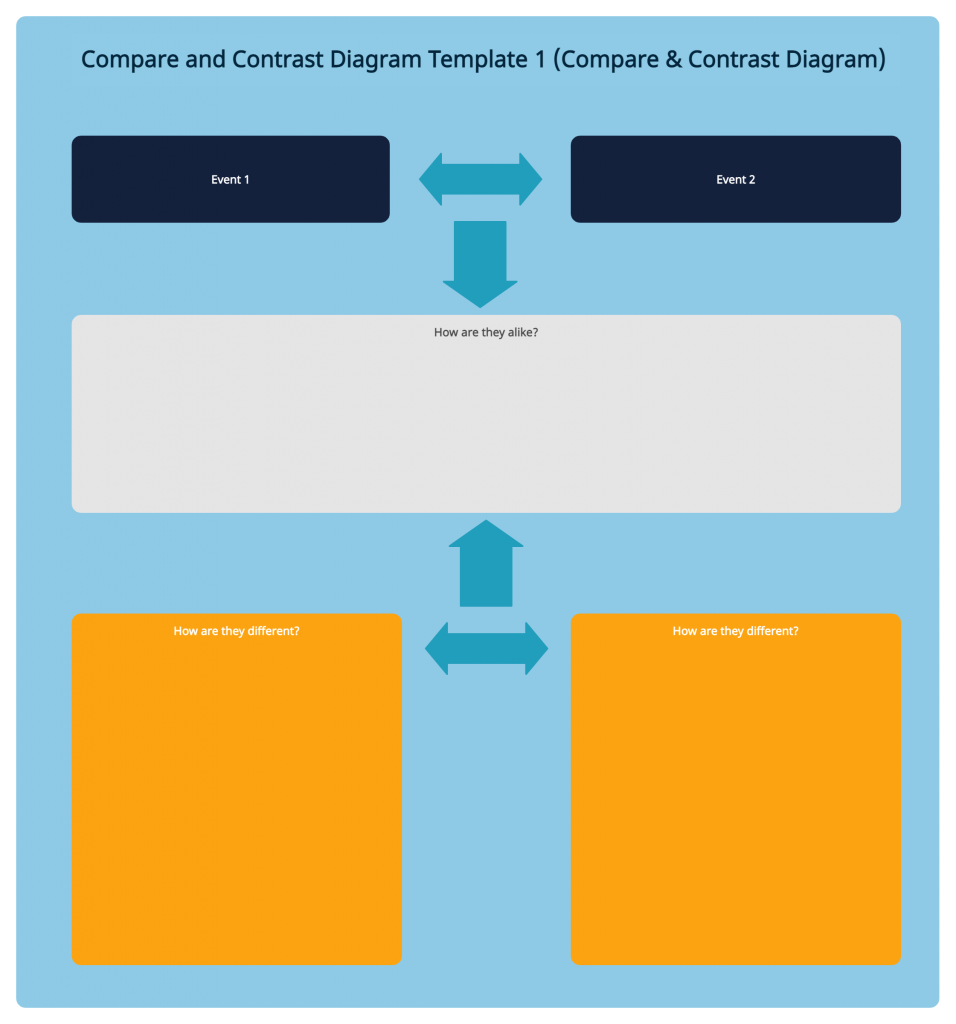
Compare & Contrast Chart
A compare and contrast chart is used to note down the similarities and differences between two pieces of literary work. Using a graphic organizer to compare and contrast a subject matter allows students to remember the facts more clearly.
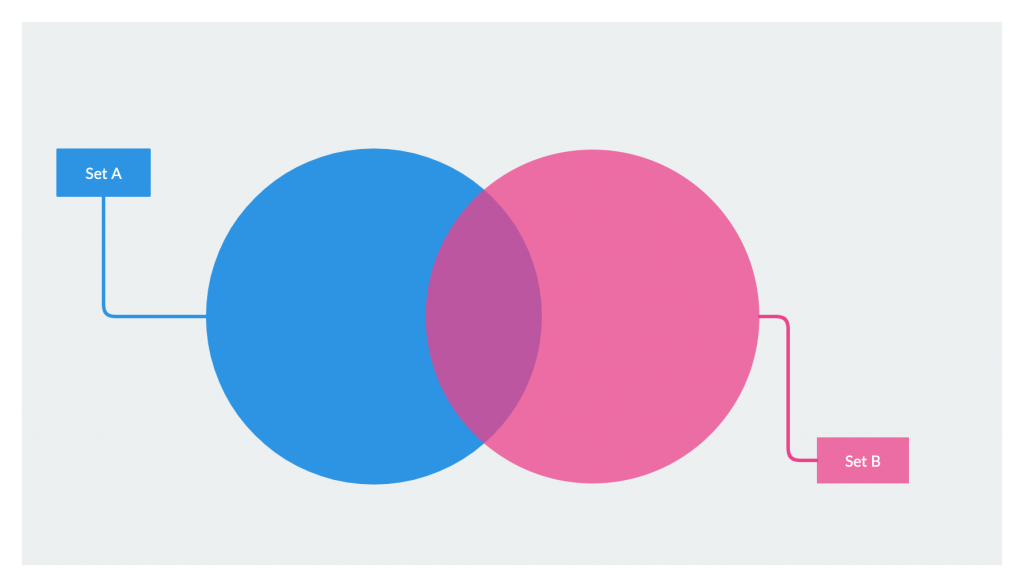
Venn Diagram
This is one of the most popular graphic organizers out there. Venn diagrams show all possible logical relations between a finite collection of sets. This tool helps students effectively compare and contrast two items.
Graphic Organizers Help Students and Teachers
Mentioned above are some of the frequently used graphic organizers. Using these in the classroom helps to increase the interaction between the students and teachers. Also if you are using a web-based tool like Creately you can use these charts and encourage students to collaborate online. So what are you waiting for?


I really appreciate the great idea of the graphic organizers and visual learning tools. These tools are very helpful these days to get the education at their own pace and from their own place. One can get story’s lessons through story boarding which is really a great technique for the kids about discussing the books. The web-based visual organize, which really helps students to understand the lessons of the story. Thank you for sharing the knowledge. Keep blogging.
Social comments and analytics for this post…
This post was mentioned on Twitter by Induja: Creately Blog – The importance of Graphic Organizers in K-12 Classrooms – http://bt.io/CASf…