Graphic Organizer Maker
Design Stunning Graphic Organizers Online
Intuitive graphic organizer software designed to bring your graphic organizer ideas into reality, making learning more interesting and engaging with interactive, visually stunning graphic organizers.
- 100s of free graphic organizer templates
- Virtual whiteboard with freehand drawing
- Real-time collaboration to work from anywhere
- PNG, PDF, & SVG export for publishing & sharing


 Diagramming Visual Collaboration Org Chart


How to Make a Graphic Organizer Using Creately
Set up your workspace
Open Creately’s graphic organizer maker and create a shared workspace. Invite peers or team members with edit access so they can collaborate with you in real time.
Define your purpose and gather information
Clearly identify the goal of your graphic organizer—whether it’s brainstorming, lesson planning, or mapping a process. Then collect the key facts, ideas, text, or images you’ll need.
Choose the right graphic organizer
Select a format that suits your purpose. For example, use a mind map for idea generation, a flowchart for processes, a Venn diagram for comparisons, or a timeline for events.
Create and customize your organizer
Start with one of Creately’s ready-to-use templates or build your own using the shape library. Arrange your information logically, add labels, apply preset color themes, and insert images or icons to make it more engaging and easy to follow. You can also start faster by using graphic organizer AI in Creately to instantly generate a base layout.
Review, refine, and share
Check your graphic organizer design for accuracy, clarity, and flow. Use @mentions and comments in Creately to get feedback, make improvements, and keep it simple for your audience. When it’s ready, export it as a PDF, PNG, or SVG—or present it directly using Creately’s presentation mode.
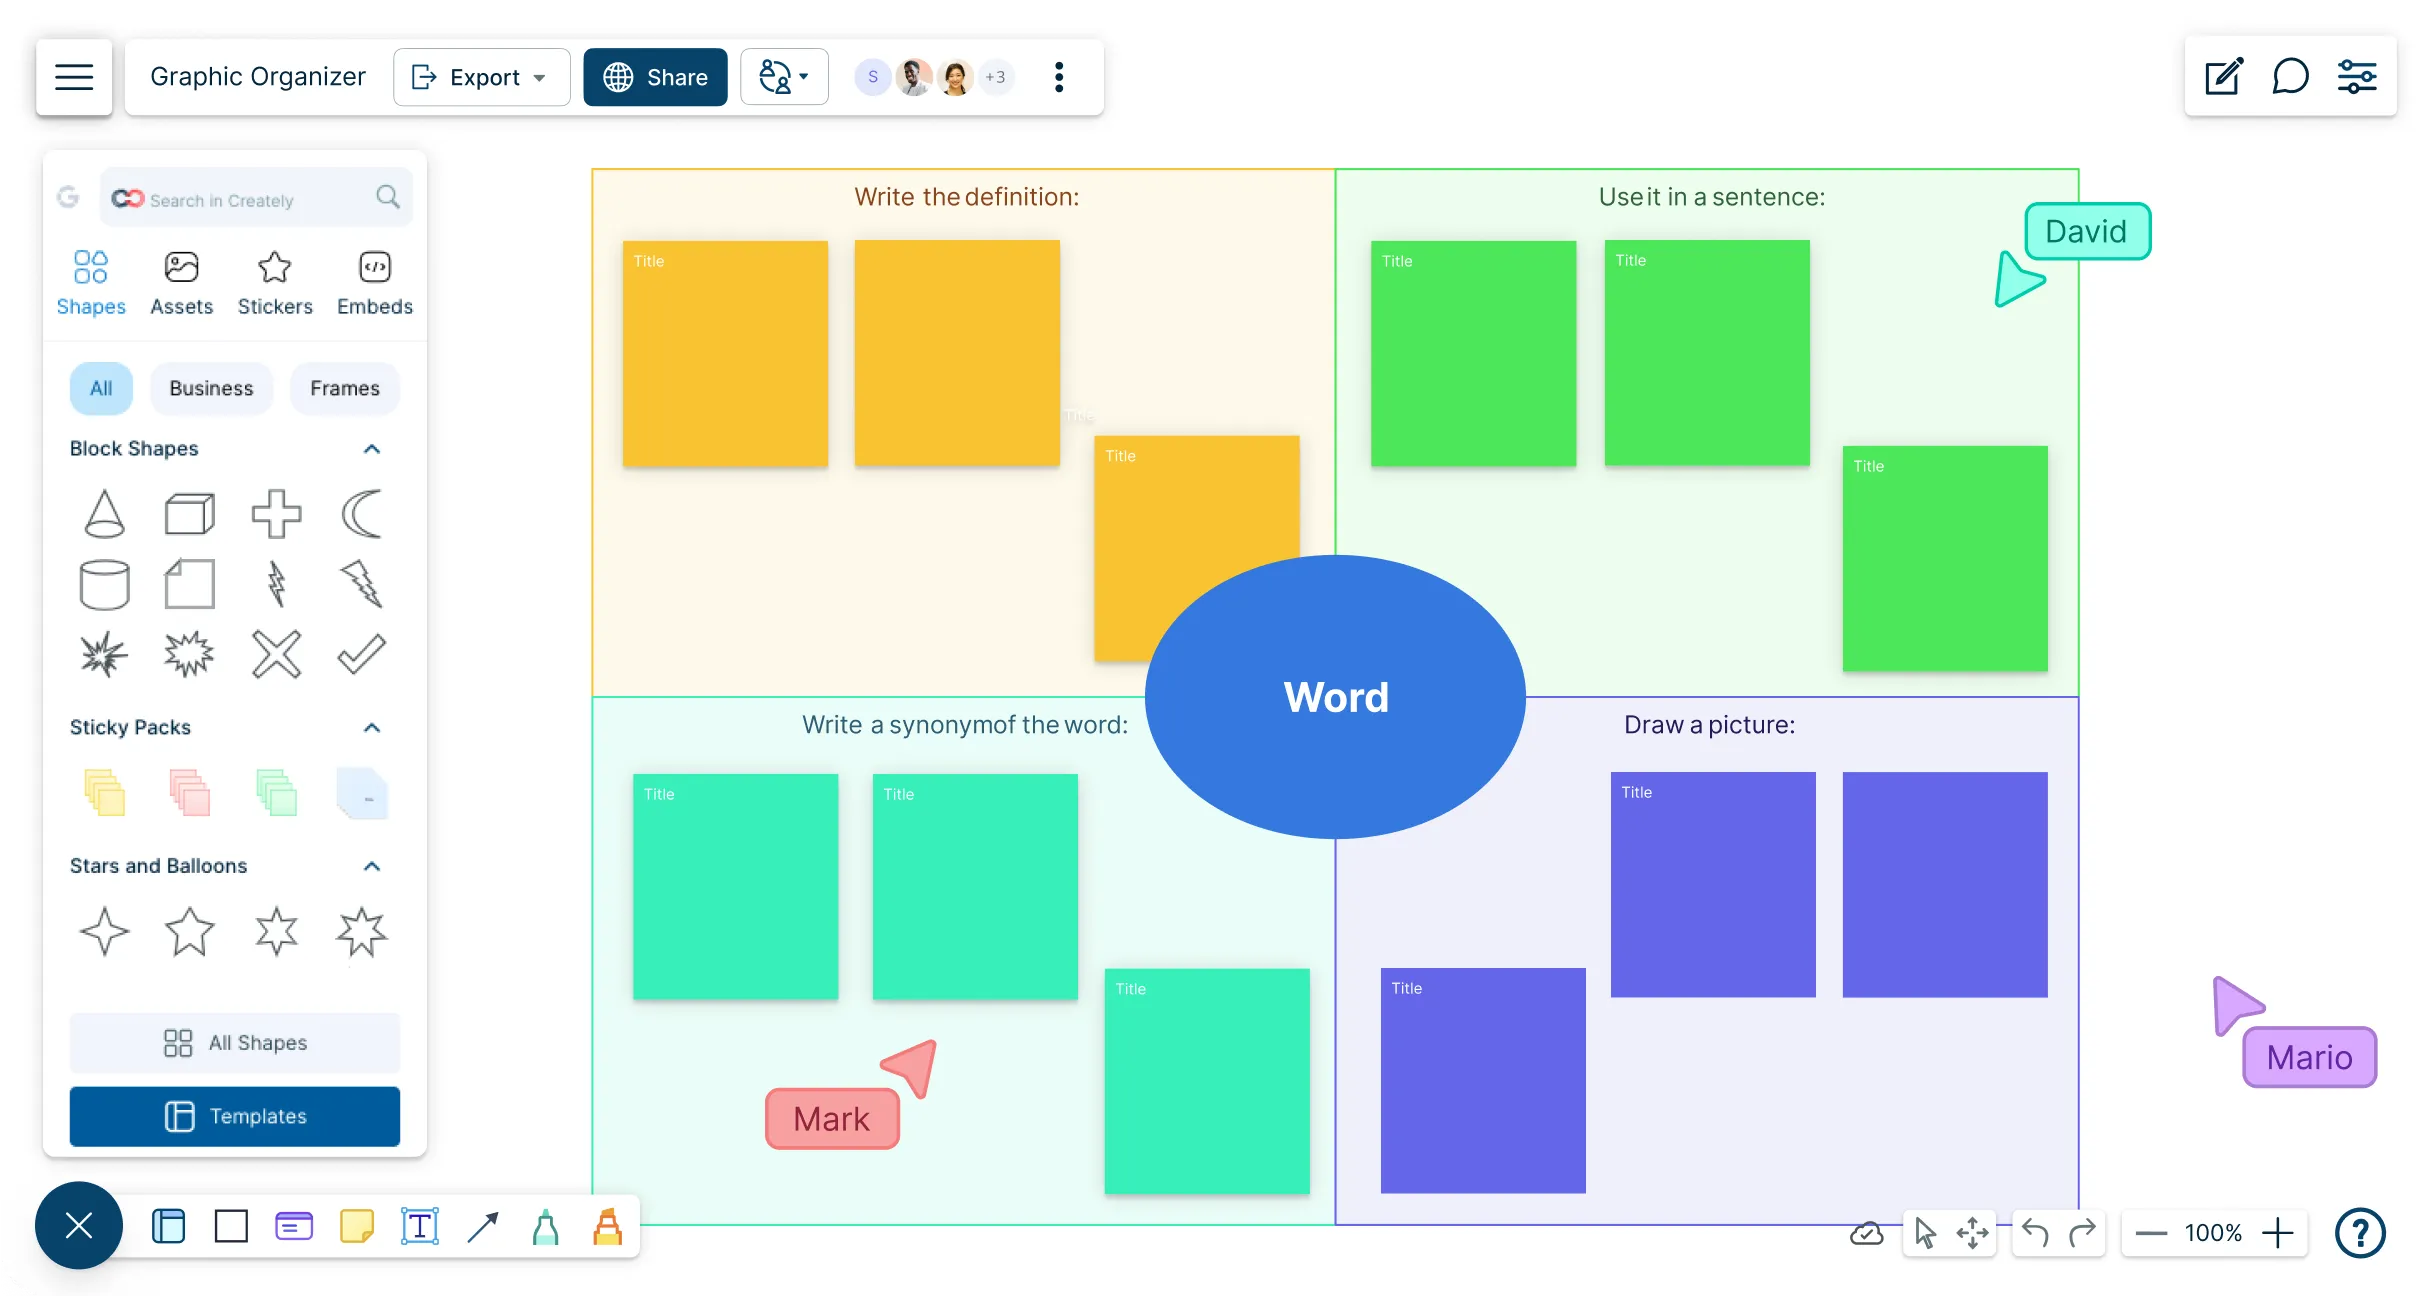
Easily Visualize All Types of Information

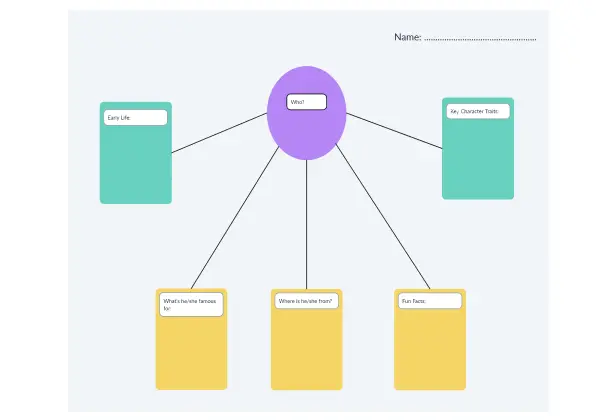
Premade online graphic organizer templates to get a head start.
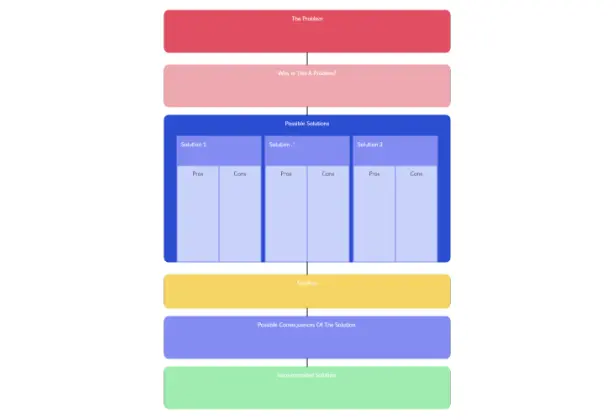
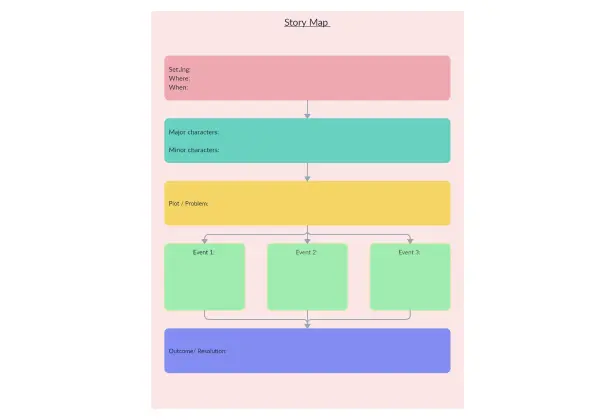
Over 50 types of diagrams for reading, writing, storytelling, & problem-solving.
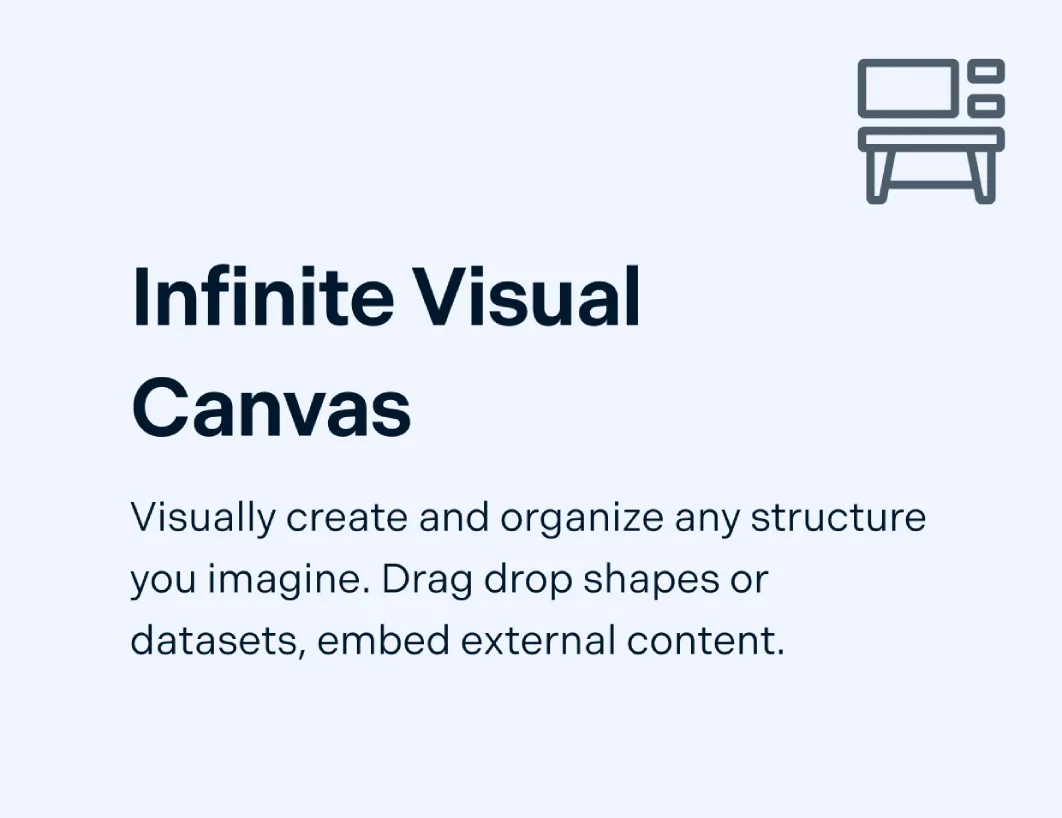
Drag-and-drop tools to map out ideas and concepts instantly.
Custom color themes and advanced text formatting for quick styling.

Centralize All Learning Resources
Add images, screenshots & illustrations to elaborate information.
Insert documents and assets to create resourceful instructional material.
Built-in tools to create dynamic and interactive presentations.
Export graphic organizer templates as SVGs, PDFs, & PNGs to publish, present, print, & share.
Interactive Graphic Organizer Generator for Collaborative Learning

Collaborate with students in real-time on a shared canvas during lessons.
Interactive online whiteboard for collaborative brainstorming & discussions.
Full comment threads and discussions for async collaboration.
Multiple access & role levels to share, review, and edit student work.
Turn Complex Lessons Into Clear Visuals
When introducing a new topic, teachers can use Creately to turn dense information into simple visual organizers that make lessons easier to follow.
Start with a ready-made organizer for reading, writing, comparison, sequencing, or cause-and-effect activities so lessons come together faster.
Adjust the layout to fit the subject, grade level, or learning objective so the organizer works for the way the topic is being taught.
Use visuals, color, and labels to break down unfamiliar ideas so students can process information step by step.
Help students connect concepts and organize their thinking in a format that is easier to understand and remember.
Build Instructional Materials Students Can Revisit
Teachers can use Creately to create lesson resources that bring explanations, examples, and supporting content together in one place.
Add images, screenshots, examples, and reference material to make abstract ideas more concrete during teaching.
Create guided activities and review resources that students can use in class, during small-group work, or on their own later.
Use the same organizer during instruction, discussion, recap, and homework so learning stays consistent across activities.
Share or export organizers for printing, presenting, or sending home so students can revisit lesson content anytime.
Make Student Thinking Visible During Class
Creately helps teachers turn graphic organizers into interactive classroom activities that support discussion, participation, and formative assessment.
Use a shared canvas during live lessons, group work, or whole-class brainstorming so ideas can be captured as students contribute.
Let students respond visually by adding ideas, completing organizers together, and building on each other’s thinking.
Use comments and feedback to review work, guide revisions, and continue support beyond the live lesson.
Share organizers with the right access level so students can view, edit, or submit work based on the activity.
What Is a Graphic Organizer Maker?

How to Use Graphic Organizers for Better Collaboration?
As visual tools, graphic organizers help individuals better organize and share information and ideas. When used collaboratively, they can be an effective way to improve communication, encourage active participation, and foster understanding among group members.
Teams can also use graphic organizers for team building, collective problem-solving or decision making, and knowledge sharing.
Teams can use online graphic organizer templates to better collaborate in various situations, such as:
Brainstorming and idea-generation sessions: Capture and organize the ideas generated by team members.
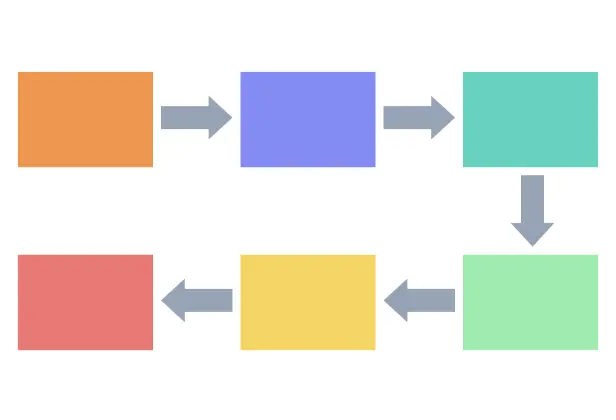
Planning and project management: Create a visual representation of the project plan, including timelines, tasks, and responsibilities.
Problem-solving: Identify the problem, its causes, and potential solutions.
Knowledge sharing: Summarize and present information in a clear and concise way. Training and learning: Organize and present training materials or to facilitate group discussions and collaborative learning.
By using graphic organizers in these situations, teams can enhance communication, encourage active participation, and promote understanding, resulting in better collaboration and more effective outcomes.
Create a Graphic OrganizerCreate Graphic Organizers in Minutes with These Free Editable Templates
FAQ about the Graphic Organizer Maker
What are Creately’s graphic organizer maker pricing plans?
- Free Plan — $0/month for basic graphic organizer creation and collaboration
- Starter & Team Plans — $8/month or $5/month billed annually
- Business Plan — $149/month or $89/month billed annually
Annual billing helps you save more while unlocking advanced collaboration, workspace management, and enhanced graphic organizer features. You can compare all available plans and features on the Creately Pricing Page.
How can you create graphic organizers faster?
Are there templates for different graphic organizer use cases?
Can teams collaborate on graphic organizers?
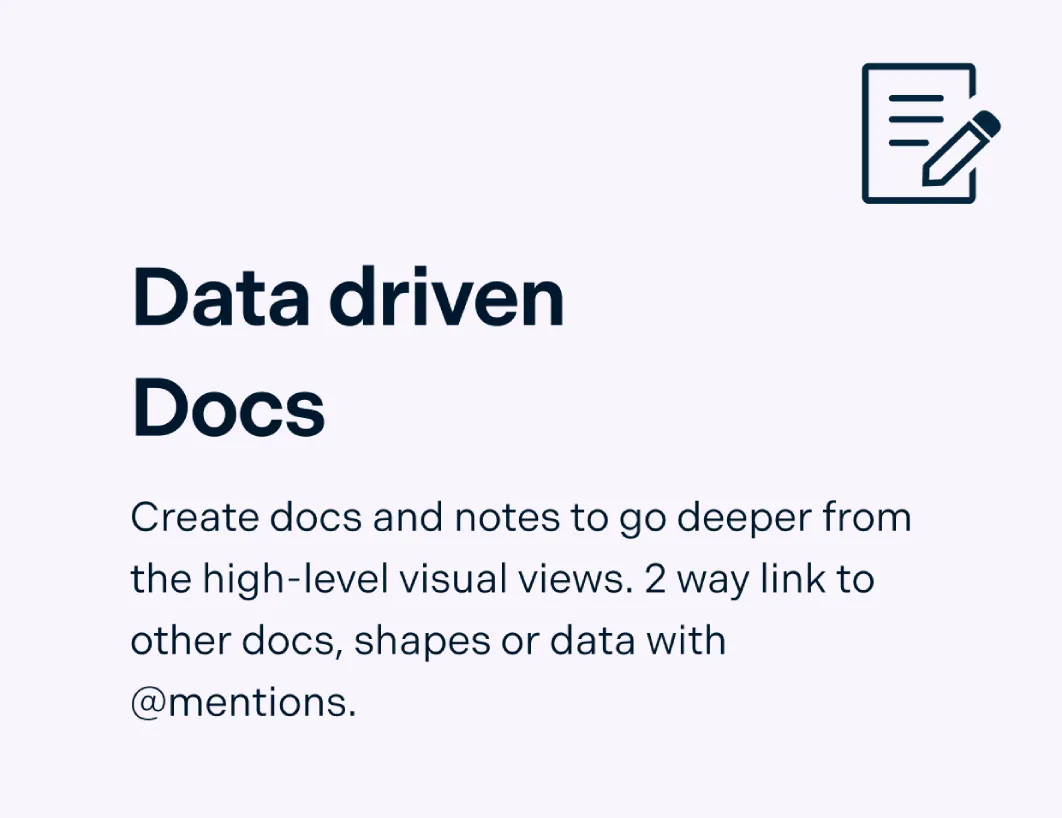
Can I add notes, data, and files?
Can I share, present, or export graphic organizers?