Over the past few days we sat down and checked out the huge set of community diagrams created by our Creately users. We thought it would be cool to choose from a superb selection of quality diagrams and share with… Read More
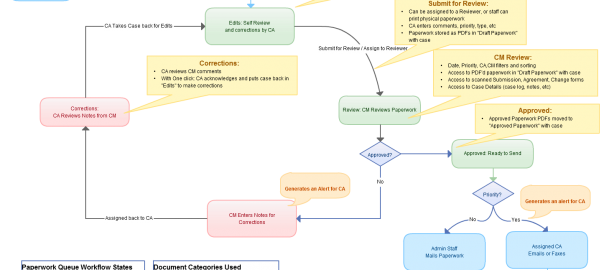
Over the past few days we sat down and checked out the huge set of community diagrams created by our Creately users. We thought it would be cool to choose from a superb selection of quality diagrams and share with… Read More
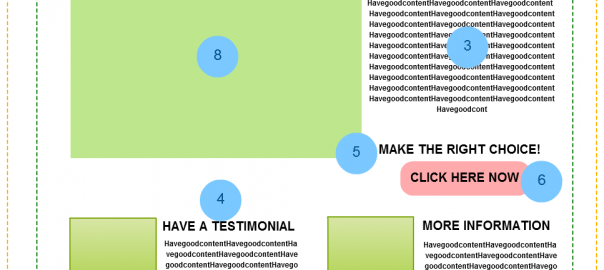
When it comes to generating more traffic for your site there is no formula as such. If you design a site that is competent and consistent, your visitors will atleast stick around and may be tell others about your site…. Read More

I was the 2nd presenter in line to have a go on the Tech Talk session series at Cinergix. I decided to make the focus of the presentation to center on a QA Quality Factor which is known as “Reliability”…. Read More
While we did say that Part 2 of this article would have been posted on Monday, we really had to make way for some exciting news. While more details on Creately for Confluence is to be expected soon, let’s carry… Read More
As part of an initiative to get out of the usual circle of thinking and space we are in and to have some fun, everyone in the Creately team was encouraged to contribute ideas and understand how the world is… Read More
You’ve got traffic? We normally use funnel diagrams to understand the flow of a user through our website, to the application, and then onto the purchase pages (or not). Some great tools are out there and just last week @Indu blogged… Read More