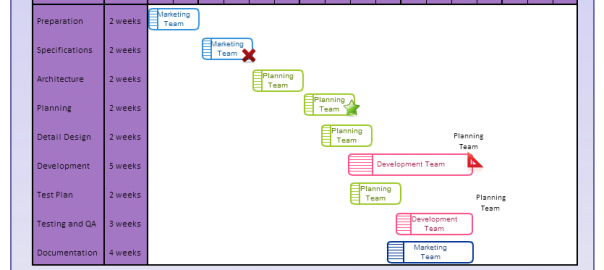
Gantt charts are the perfect to quickly visualize a timeline of the project. It helps you to plan effectively and keep a track of the project schedules. Most Gantt chart software generates the Gantt chart after you’ve added the tasks and estimates. But sometimes… Read More
When it comes to analyzing the feasibility of a project SWOT is up there with the best of them. Its powerful enough to diagnose a business and simple enough to be used by an individual. However if not done properly it can… Read More
Our users add thousands of diagrams to the community everyday and we frequently come across good diagrams that can become great diagrams with some simple tweaks. Do you want to create beautiful diagrams that stands out from the rest? Then keep… Read More
Although mostly used in mathematics there are many other usages for Venn diagrams. Everyday hundreds of Venn diagrams are created by our users and below are some creative Venn diagrams from our diagramming community. One creative way to use Venn… Read More
Halloween is the spookiest night of the year, when spirits wander the earth freely and children wander the neighborhood seeking candy and causing havoc. Traditional activities include trick-or-treating, bonfires, costume parties, visiting “haunted houses” and carving jack-o-lanterns. Halloween is a… Read More
We all like visual presentations. That’s the impetus behind the popularity of infographics. According to sources quoted by the Visual Teaching Alliance, our eyes can register 36,000 visual messages per hour (Jensen, 1996) and “90 percent of information that comes… Read More