When you want to present the bigger picture in an easily understandable way or define your ideas/proposals succinctly, visual representation works better than just words. Here’s where diagrams can be useful in breaking down different elements of an idea or thought, and say a lot without actually saying too much! There are five such essential diagrams that you can use in just about any setting such as business, education or home science.
1. Mind maps
A mind map is a graphical representation of concepts and ideas. It breaks down big topics into handy chunks, creates associations between various elements of the topic and explains the structure of the topic in an easy way. It encourages the use of color and images, with some resembling works of art. A mind map is a powerful visual thinking tool that gives you clues to recall the information contained within it.
- Project managers use mind maps to describe ideas and agendas to teams
- Students use them as a mnemonic tool to remember structures or shapes of a study topic clearly and easily
- Mind maps help event planners organize different aspects of their upcoming event
- In the hands of marketers, mind maps can offer different potential avenues to promote products/services
- Mind maps are an excellent collaborative tool for team members of a project
- Creative writers use them to define a method to their madness
- Business owners use mind maps to develop dynamic business plans
To create a basic mind map, you start at the center of the page and draw a picture/geometric figure for your central idea. There will naturally be major subheadings under the core idea that directly relate to it. These can be lines or rays that you draw outwards from the central image. You then delve into the next finer level of subheadings that delivers more information and is important to completely understand the bigger idea. These can be lines/rays linking to the subheading lines. Basically, a mind map grows by association; you can incorporate drawings, myriad colors and a slew of connecting shapes to create this diagram.
Creately’s mind mapping tools are easy to use and the real-time collaboration features make it perfect for teams as well. Can’t wait to get started? Our professionally designed mind map templates speed up the process and presents you with plenty of mind mapping ideas. Like the mind map below? Just click on it and modify to your liking.
E.g.: Weekly Employee Meeting Mind Map

A Weekly employee meeting mind map. Useful in many situations mind maps is a must in your essential diagrams list. ( click to use this template )
2. Flowcharts:
There is no one definition for a flowchart. A computer programmer will tell you that it is a step-by-step diagram to describe a complex program, while a business professional will call it a process map or a graphical representation of data flow in an organization. The purpose of a flowchart is to give a reference point when communicating or dealing with a process, problem or project. Like a mind map, it can be used in various situations to great effect.
Before you can draw a flowchart, you will need to identify inputs and outputs and cause and effect. You will also need to be familiar with the standard flowchart symbols or ones that your company may use as a standard. Once you have figured these two aspects, you draw the ‘start box’ and then add subsequent boxes that follow a logical sequence of questioning, i.e. answer the question ‘what happens next?’ To understand the basics of creating a flowchart, click here.

Flowcharts are probably the most popular diagram type in the world and deserves a place in essential diagrams list
Now that we have added flowcharts to the essential diagrams list next step is to give you tools to draw them. Our flowchart tools comes with some awesome features like 1-click create and connect which will help you become even more productive.
3. Fishbone Diagrams
The fishbone diagram was invented by quality control expert Dr. Kaoru Ishikawa. The operative phrase here is ‘quality control’, which tells you that this diagram visually represents the cause and effect analysis of a problem. You create this diagram in the shape of a fish. Start with the head, which is the problem in question. A straight line leading to the head is the fish’s backbone. Lines connecting to the backbone are the ‘causes’ of the problem or the first bones of the fish. Each cause will then need to be brainstormed to break it down further. This way of identifying root causes will help you zero in on potential solutions.

Fishbone diagrams, sometimes referred as cause and effect diagrams
Our diagramming community has many Fishbone diagram templates so all you have to do is modifying them to fit your requirement.
4. Hierarchy Charts / Org Charts
A hierarchical chart is a type of organizational chart that presents the relationships and ranks of people within the organization. These relations and hierarchical structures may include top-level management only or management and subordinates, depending upon the purpose for which the chart is being used. A much-leveraged benefit of a hierarchy chart is explaining the chain of command to new employees. It can be used in a number of scenarios, including business proposals and in-house strategy meetings to gain clarity into a business functioning and management roles.
Hierarchy charts are easy to create, involving one basic shape such as a rectangle or oval to indicate the position/role and ascending or descending lines that logically indicate the seniority of each position/role within the larger organizational framework. It can resemble a family tree diagram, with CEO, top-level/senior management on top of the chart and the branches (descending lines) indicating middle-level management, team leads and employees.

If you’re working at a company the organizational / hierarchy charts are a must have in your essential diagrams list
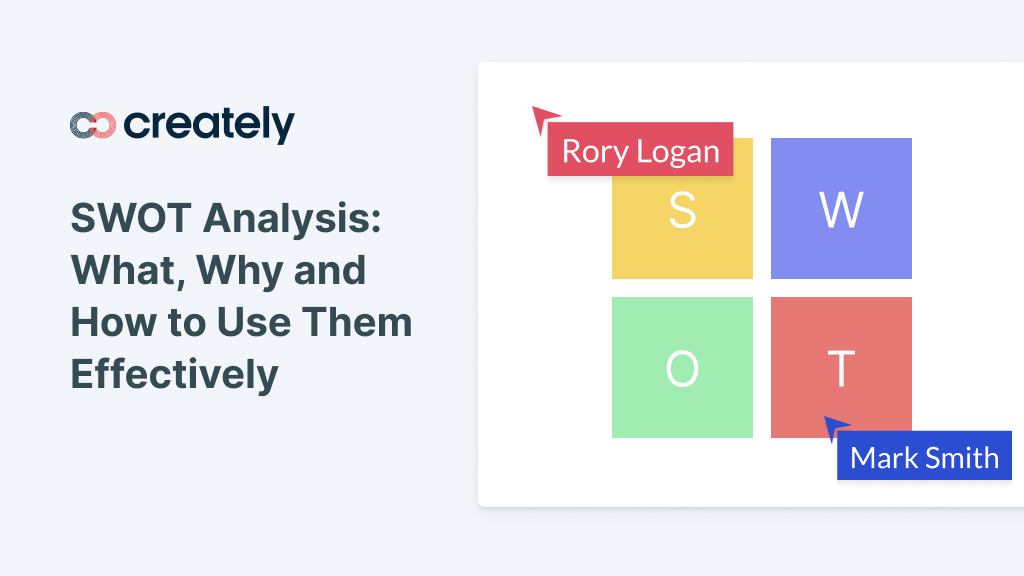
5. SWOT Analysis Diagrams
A SWOT matrix provides a visual framework to analyze four key elements – strengths, weaknesses, opportunities and threats. From helping you extract maximum advantage from business opportunities and identifying weaknesses and minimizing them, to building on your strengths in a particular area of business and preparing you to counteract threats from competitors, this diagram finds utility in a number of scenarios.

SWOT analysis diagrams are useful in many situations including planning and forecasting
A working knowledge of these five essential diagrams can make a big difference in the way you address problems, get your point across, and manage your work. Creately understands this perfectly well and has made your job of leveraging these highly-beneficial visual thinking tools super-easy.
That our site serves as a knowledge resource is just one thing. We offer professional diagramming and collaboration tools for your desktop and apps that deliver 40+ types of diagrams and thousands of templates to your fingertips.
What are Your Essential Diagrams?
Listed above are some generally essential diagrams. Depending on your job these can change dramatically. For example if you’re a software engineer then UML probably ranks very high in your essential diagrams list. Can you think of another generally used diagram type that is essential? Do mention it in comments and we’ll consider adding it.


Another very interesting diagram is entity-relationship diagram.
It is simple, useful, and powerful in even general discussions, let alone technical discussions.
Some very essential diagrams everyone should know before entering the professional world. These diagrams should be thought to us in university level to make a better understanding of it as it relates to the work chart. Nice article.