A few posts back, we illustrated a few tips on how text can be used visually for better clarity and readability. In this post, which uses a presentation done by Enrique Garcia Cota as a foundation, we turn our attention to diagramming shapes and how they can be utilized better. Just like in the last post, we’ve identified 5 tips that can help you draw diagrams more effectively. In order to make it more relevant and easier to understand, we’ve put these tips into context.
1. Make use of a Grid
Using a grid when drawing would make your diagrams look better aesthetically. If you consider the diagram below, you will see that enabling the “Snap to grid” function (just right click the mouse in Creately), helps keep drawing more aligned and focused, thereby allowing for some aesthetic discipline.

2. Utilize images where Applicable
Diagramming has taken on better direction with the use of imagery in flowcharts and mindmaps. As shown below, you can easily use Creately’s search function to scour for images from our object bank and images from Google and icons from IconFinder. All this allows you an opportunity to draw diagrams that are meaningful, better illustrated, and prepped up to better connect with your audience.

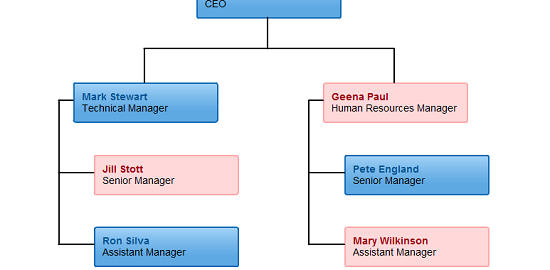
3. Ensure objects are Aligned
When it comes to certain types of diagrams like flowcharts, mindmaps and business diagrams, things can get a wee bit messy, especially if these diagrams are large and detailed. So aligning the relevant objects of these diagrams is vital, that is if you seek some method to the madness! With Creately, aligning objects is a matter of selecting the relevant objects and the app’s smart and intuitive Contextual Toolbar will appear.

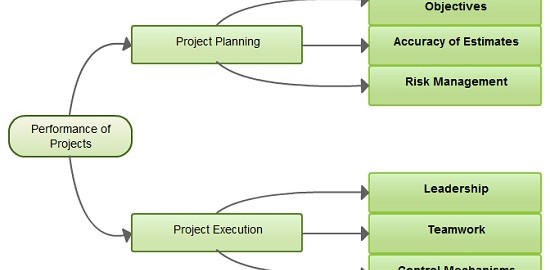
4. Use relevant Objects
One of the most common mistakes would be when diagrammers use the wrong object in a diagram. For instance, many do not know the difference between the Process and Decision objects. Putting in the wrong objects can confuse a diagram not to mention that it’ll make an official diagram stand out like a sore thumb. Understanding diagrams is key when it comes to drawing like a pro; Creately offers minisites on different types of diagrams, which provide in-depth detail and answers some of the more common questions that you may have. Refer the minisite on flowcharts here.

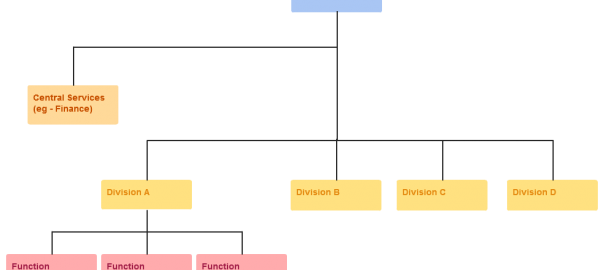
5. Use size to show Hierarchy, Importance and Quantity
Finally, when you do draw a diagram, make sure you think logically and imaginatively. For instance, as a general rule you could depict hierarchy, importance and quantity by the size of certain objects. In the stakeholder map below, the quantity of the different staff is illustrated by the differences in size of the circles. If you do want to be more detailed you could plug in the exact quantities, but this would defeat the purpose of showing quantity from a pictorial perspective.

That wraps up this post, in the meanwhile, do get in touch with us here, if you do have any queries. For more interesting tips and trends on diagramming, stay tuned to this space.